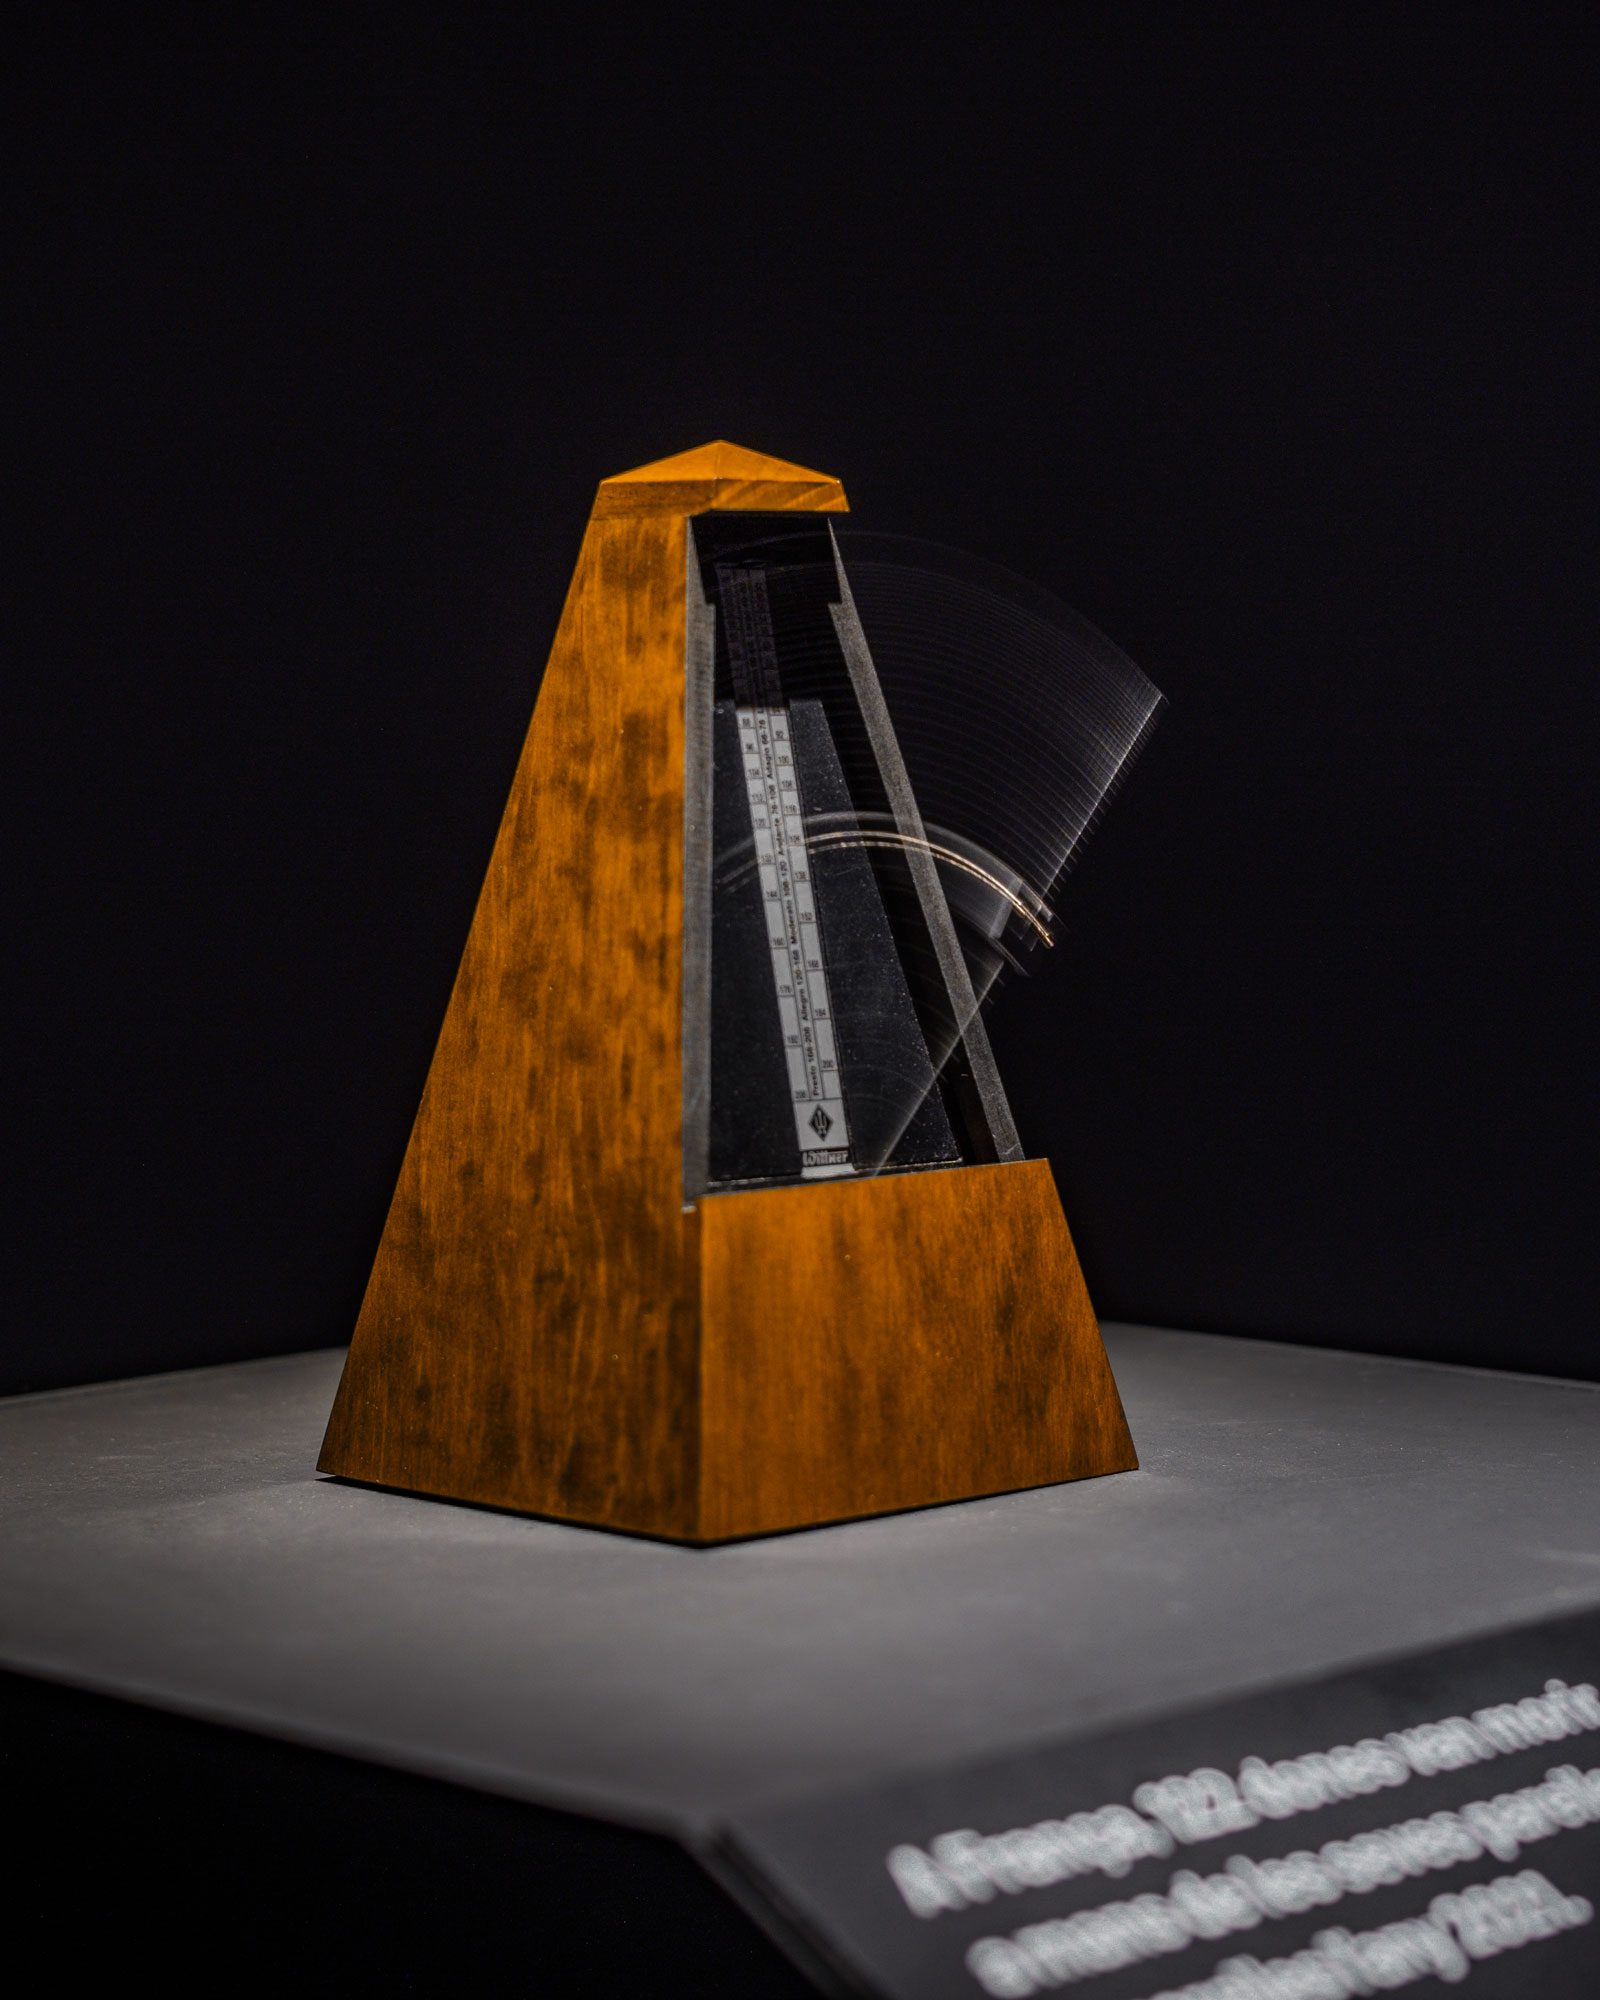
Data vibrates at a quantum level in every server in which it’s stored. It is invisibly flooding the digital space, encoded in the mathematical script and hidden from sight.
And yet, data is far from being cold and unfeeling. It’s telling stories about you; about the food in your fridge, the water you drink. It notes down everything you’d buy if you had enough money, and knows how obsessed you are with that K-pop boy band.
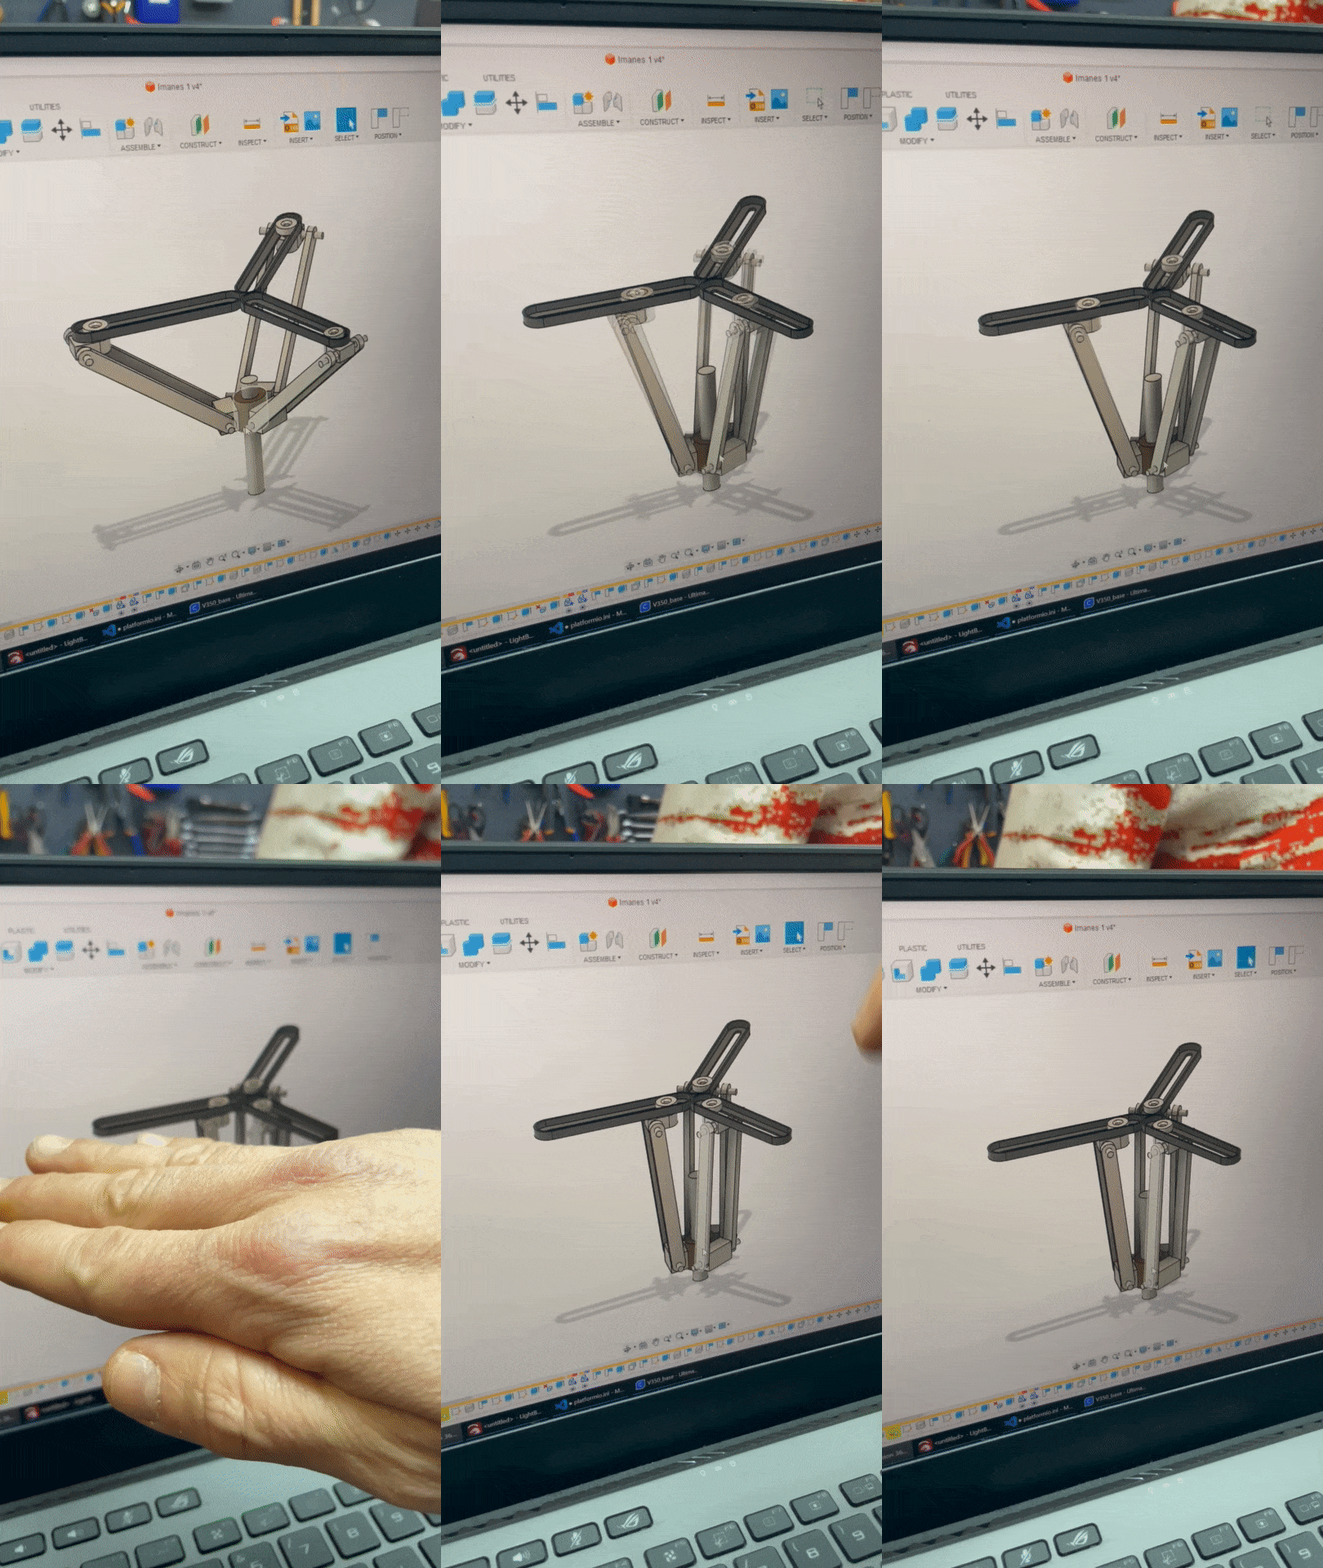

We set out to produce an artwork that would map human connections online, to reunite us with the physical reality at the heart of our digital story. The story will be told in the history books of the future. Just take a look at the ancient Egyptians, who employed a select class of trained scribes to record everything from the grain stock to wills, contracts, and court proceedings. Or medieval manuscripts that carried our written heritage from place to place, from reader to reader.
In writing down this information the authors anonymously left their mark, and thus, shaped history as we know it. They curated and protected the data they believed had to be preserved to inform future generations.
In today’s Post-Digital Age, creating and storing data is easier than ever, and this process is no longer reserved for a privileged elite. That said, we cannot jump to assume that the internet is a public forum, free and accessible to everyone. In fact, today only 64.4% of the world’s population is online. Furthermore, the Internet is privately owned and exists inside private servers that capitalise, exploit, and influence human behaviour. Under these conditions, we can understand that just because more data is being created, more scribes if you will, does not mean that the history we are writing is more representative.
This future history of ours is, in part, made up of social media algorithms, search engines, IoT, and media sites that furnish our digital environments with endless, unfiltered content. Our attention is treated as a commodity and in such an economy an abundance of fresh headlines, images, and posts are generated every second, without regard for whose reality they speak for, let alone the huge environmental consequences of storing all this data.
The Material Question
Amidst optimistic anticipation of a new millennium, the arrival of the internet signalled a global transformation towards interconnectivity and freedom of information. Many were hopeful that this would also mean considerable dematerialisation: with the internet seeming to exist invisibly in the ether. But like so many of our pre-2000s assumptions about technology, this turned out to be wildly misguided.


The carbon footprint of our gadgets, the internet, and the systems supporting them currently account for about 3.7% of global greenhouse emissions, on par with that produced by the entire airline industry. We don’t hear the internet flying over our heads, and it doesn’t take up huge swathes of land around our cities. So, how do we better understand the physical implications of billions of people producing content online?
The impact doesn’t end there. The cartography that’s generated in our piece with each passing second also speaks of a change in the Earth’s actual topography. It implies material extraction (lithium, cobalt, tantalum, among many others), which, in turn, leads to poor labor conditions and contemporary forms of slavery.
In this context, questioning our digital imprint becomes more relevant than ever. Does storing absolutely everything make sense? Are we aware of the impact that digital storage has?
In questioning our digital legacy, and the impact of digital storage, we wondered what a scribe for modern times might look if they had to prioritise and physicalise the internet we currently inhabit.

Our never-ending map
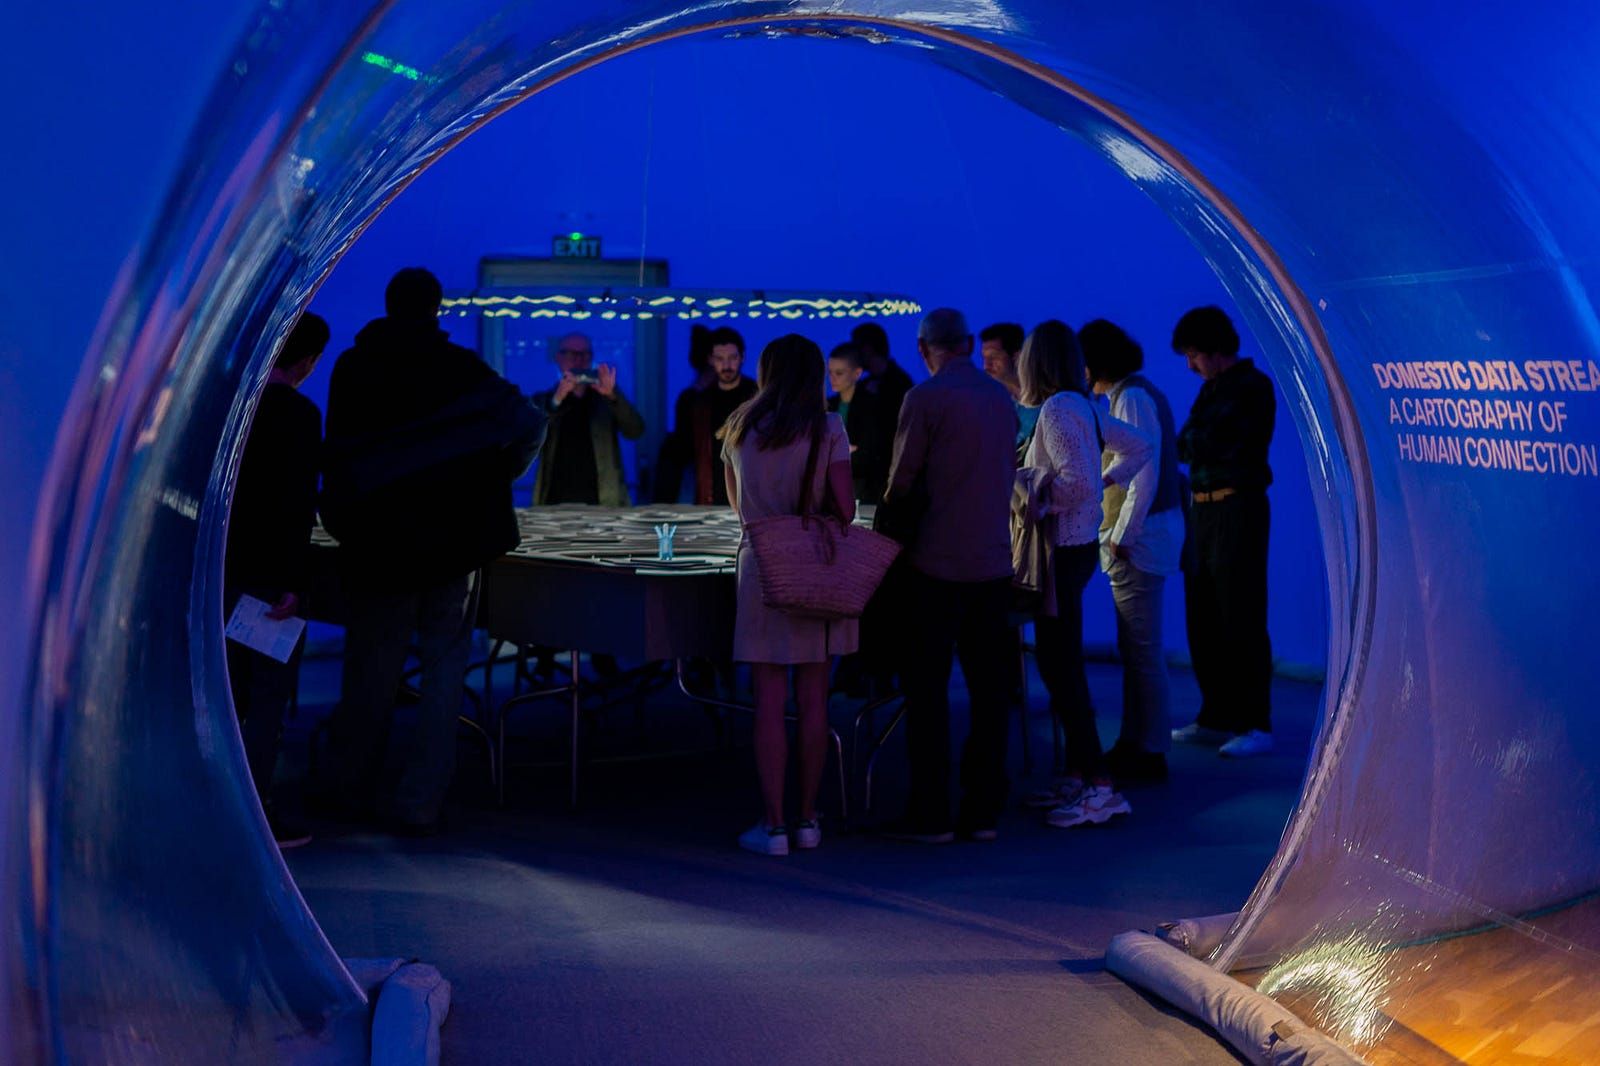
Driven by these questions we set out to produce a “Cartography of Human Connection”, that would return to the figure of a scribe to map this chaotic landscape of online data generation.
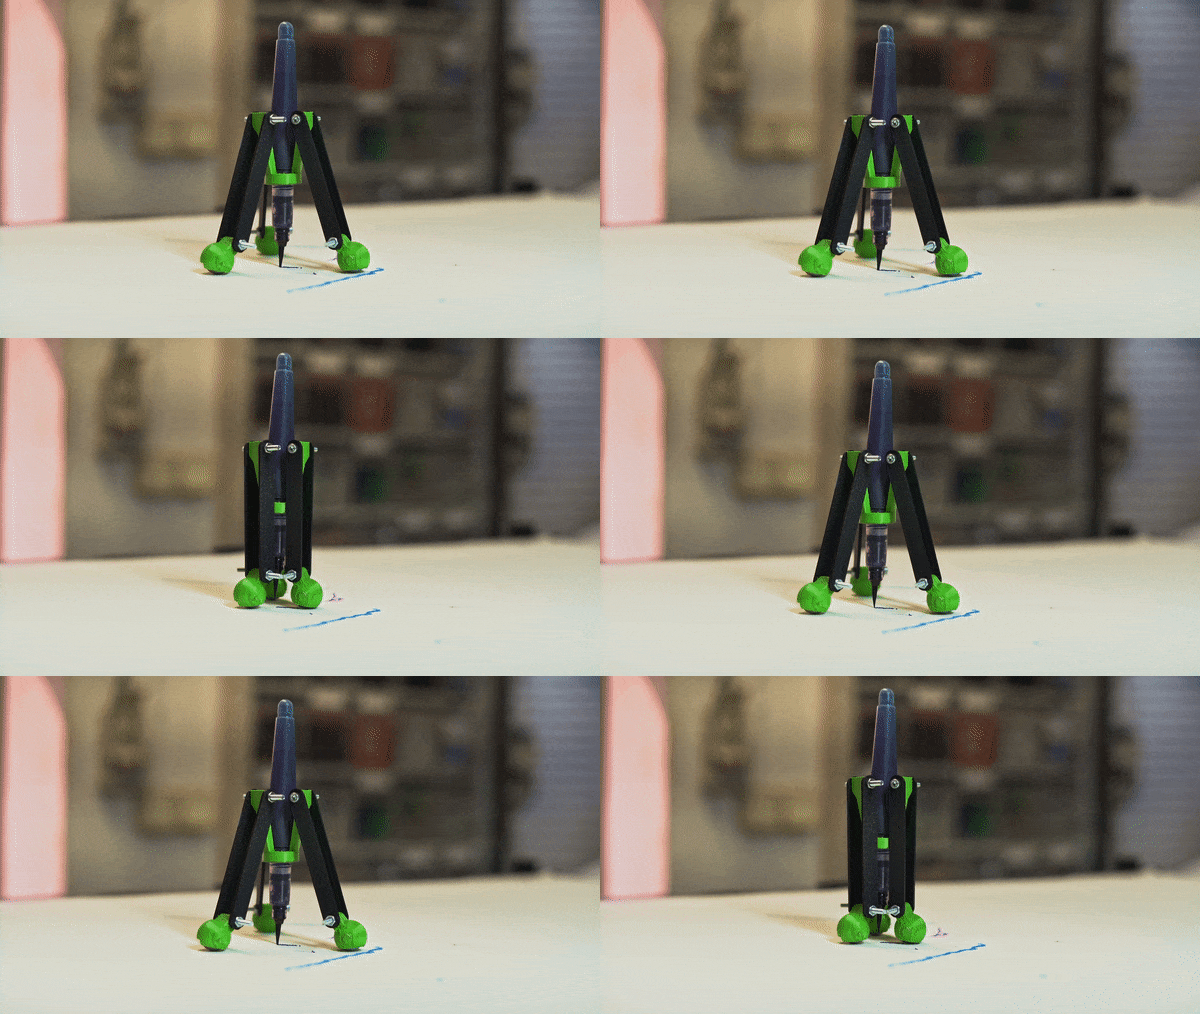
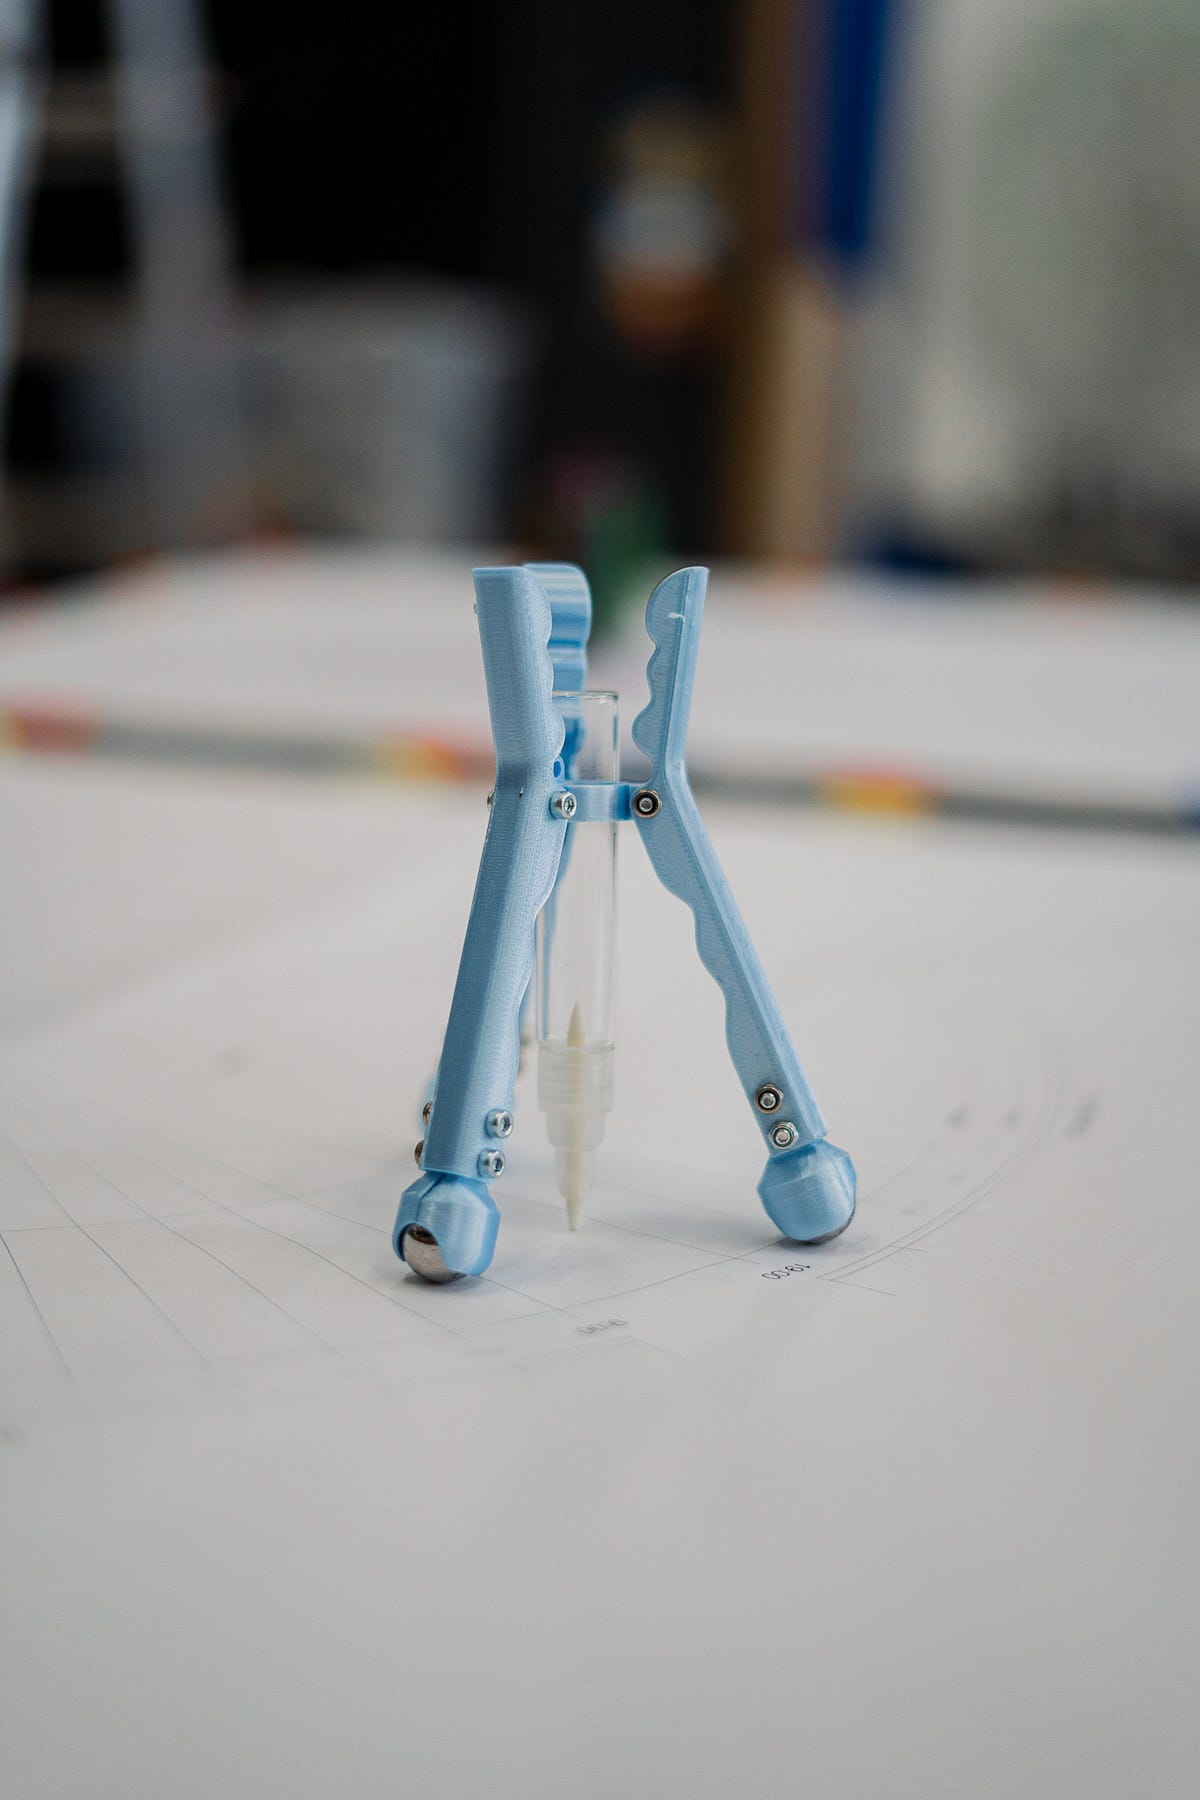
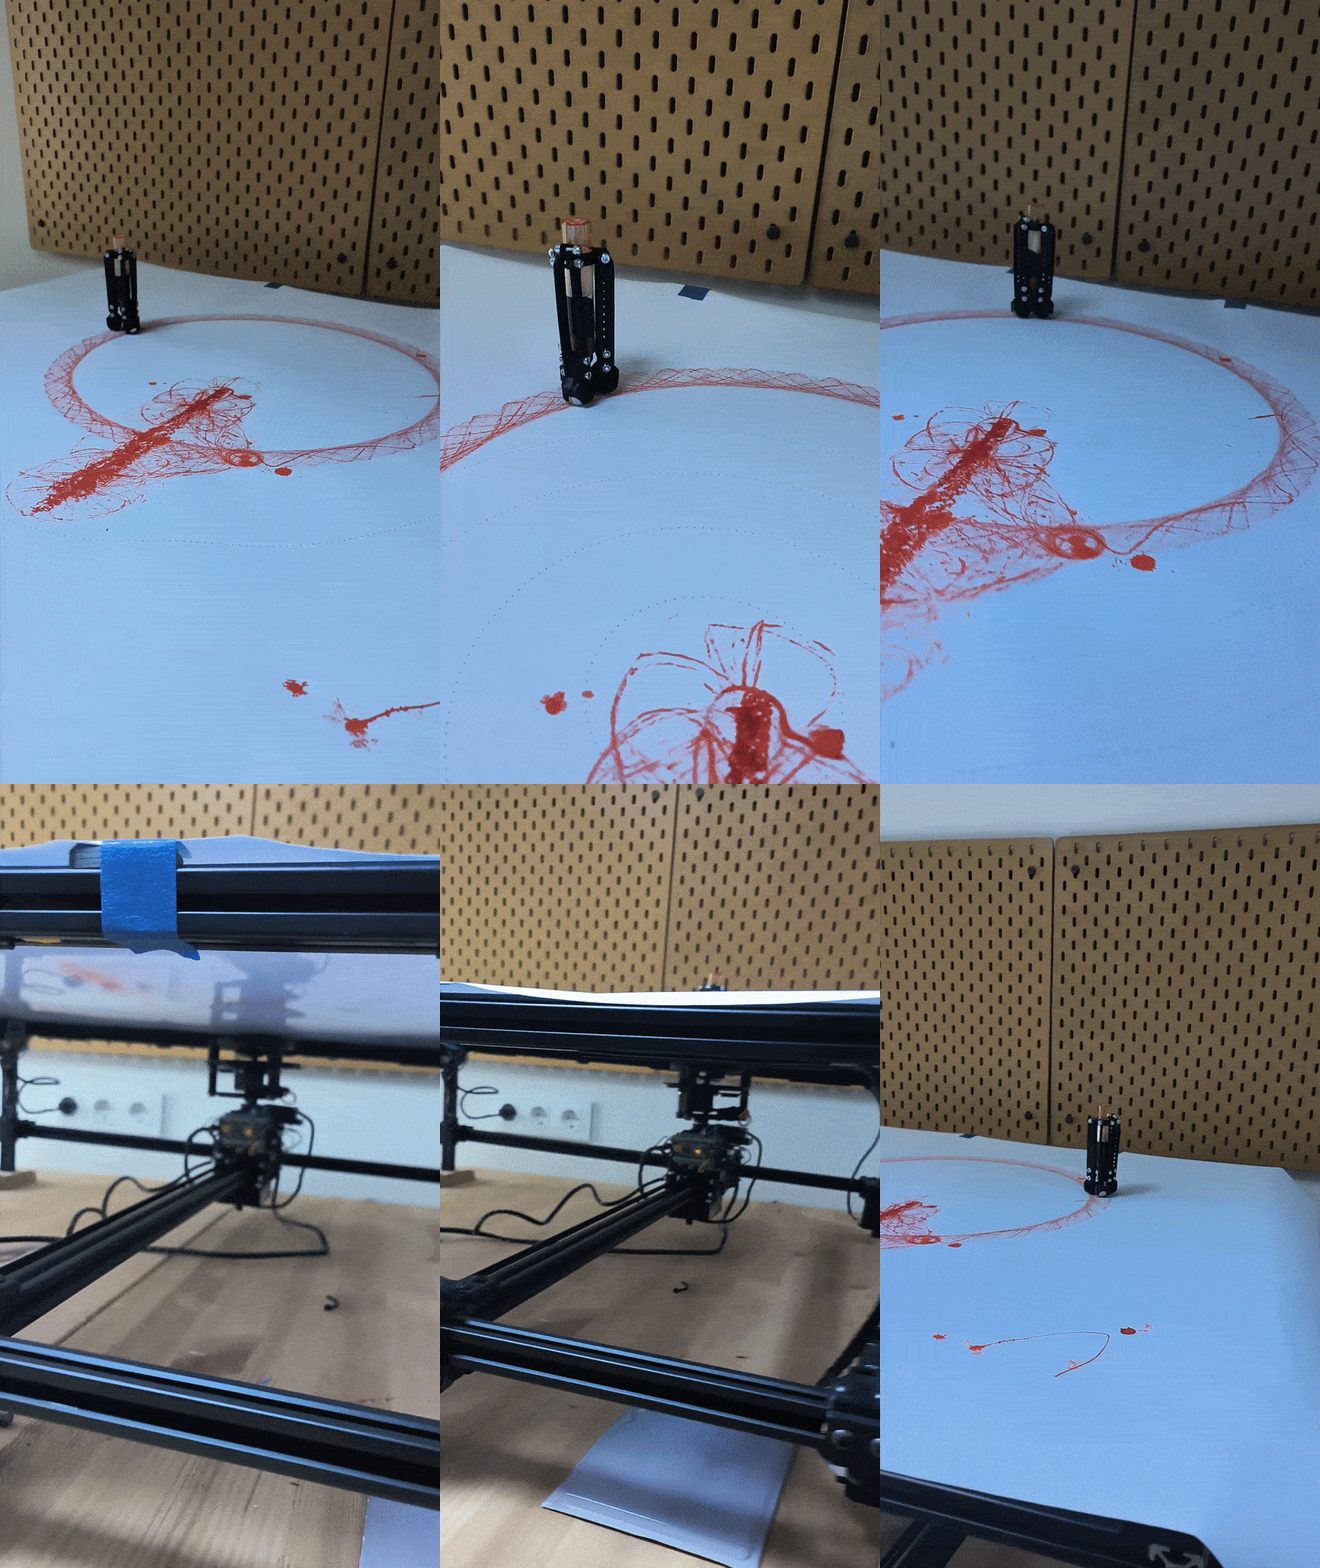
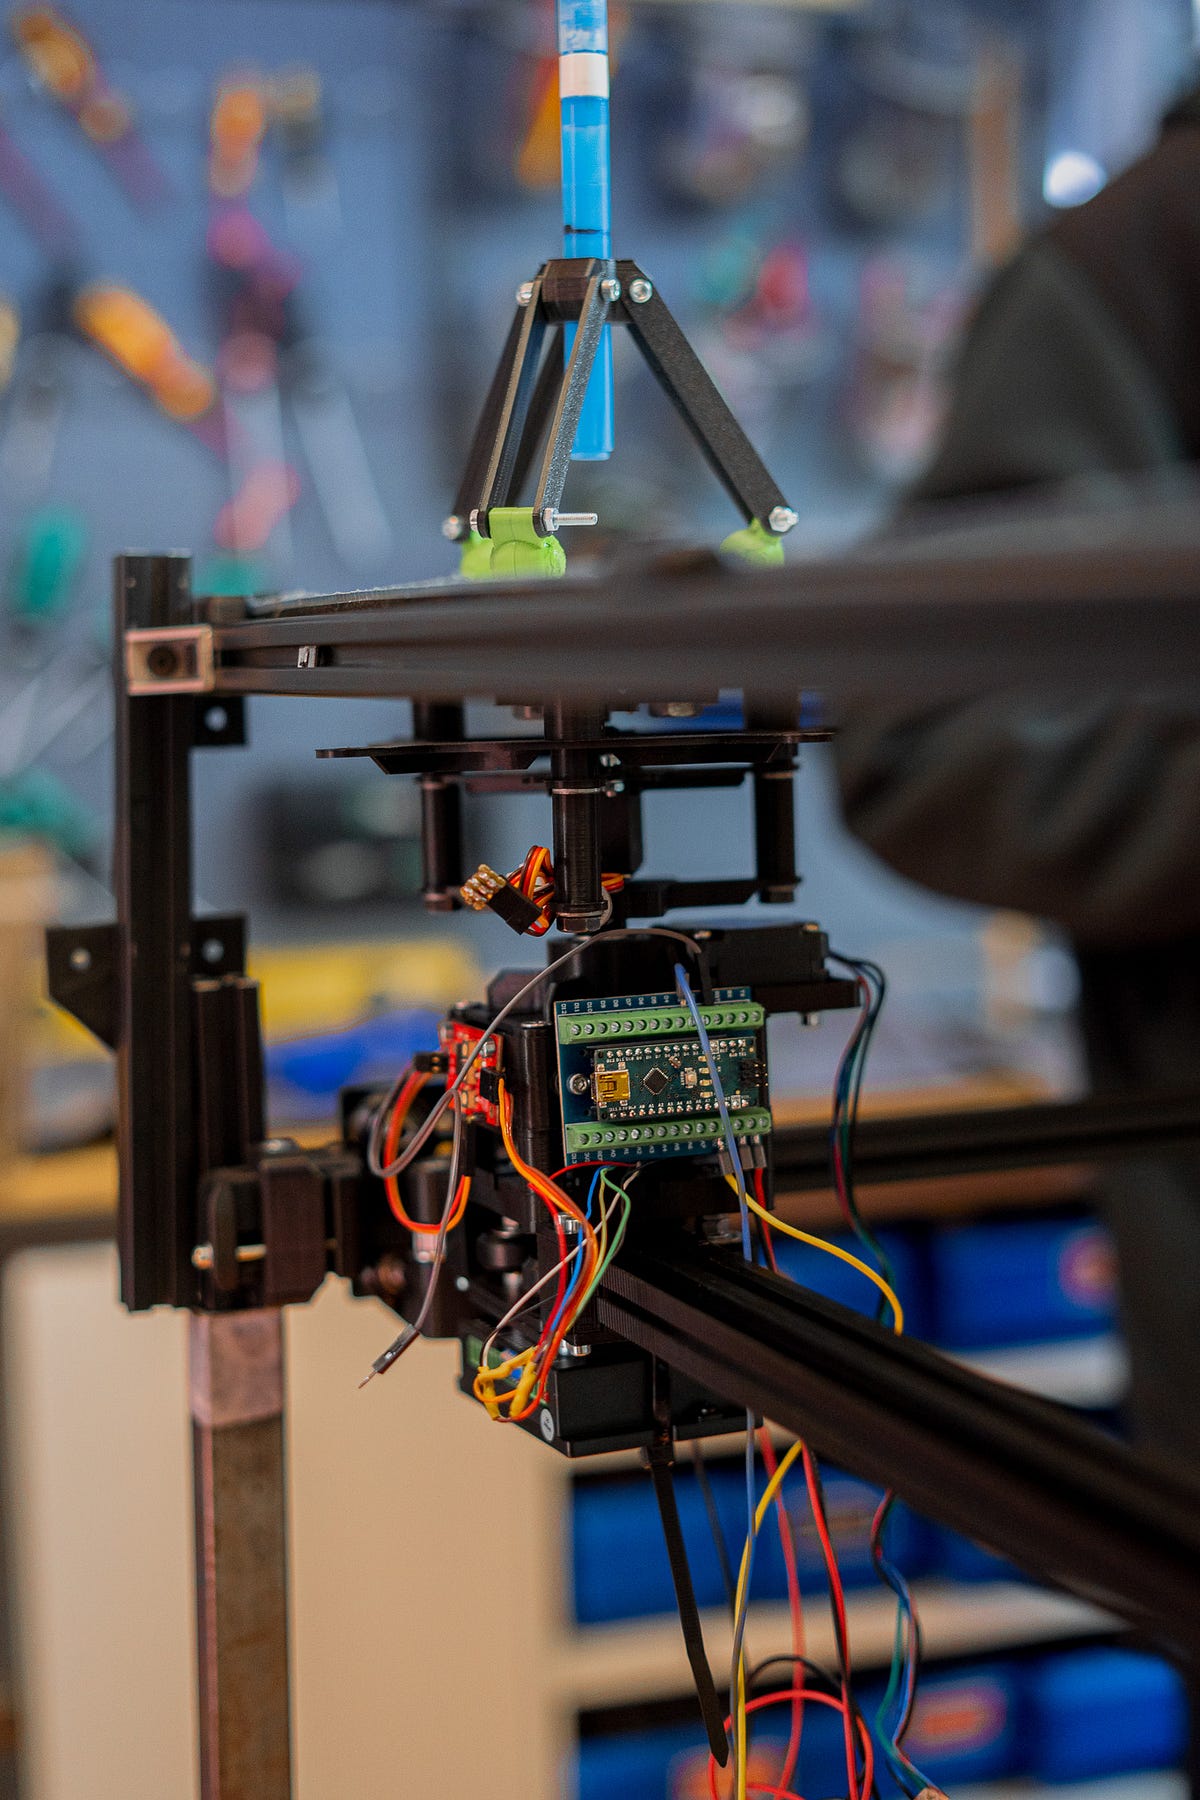
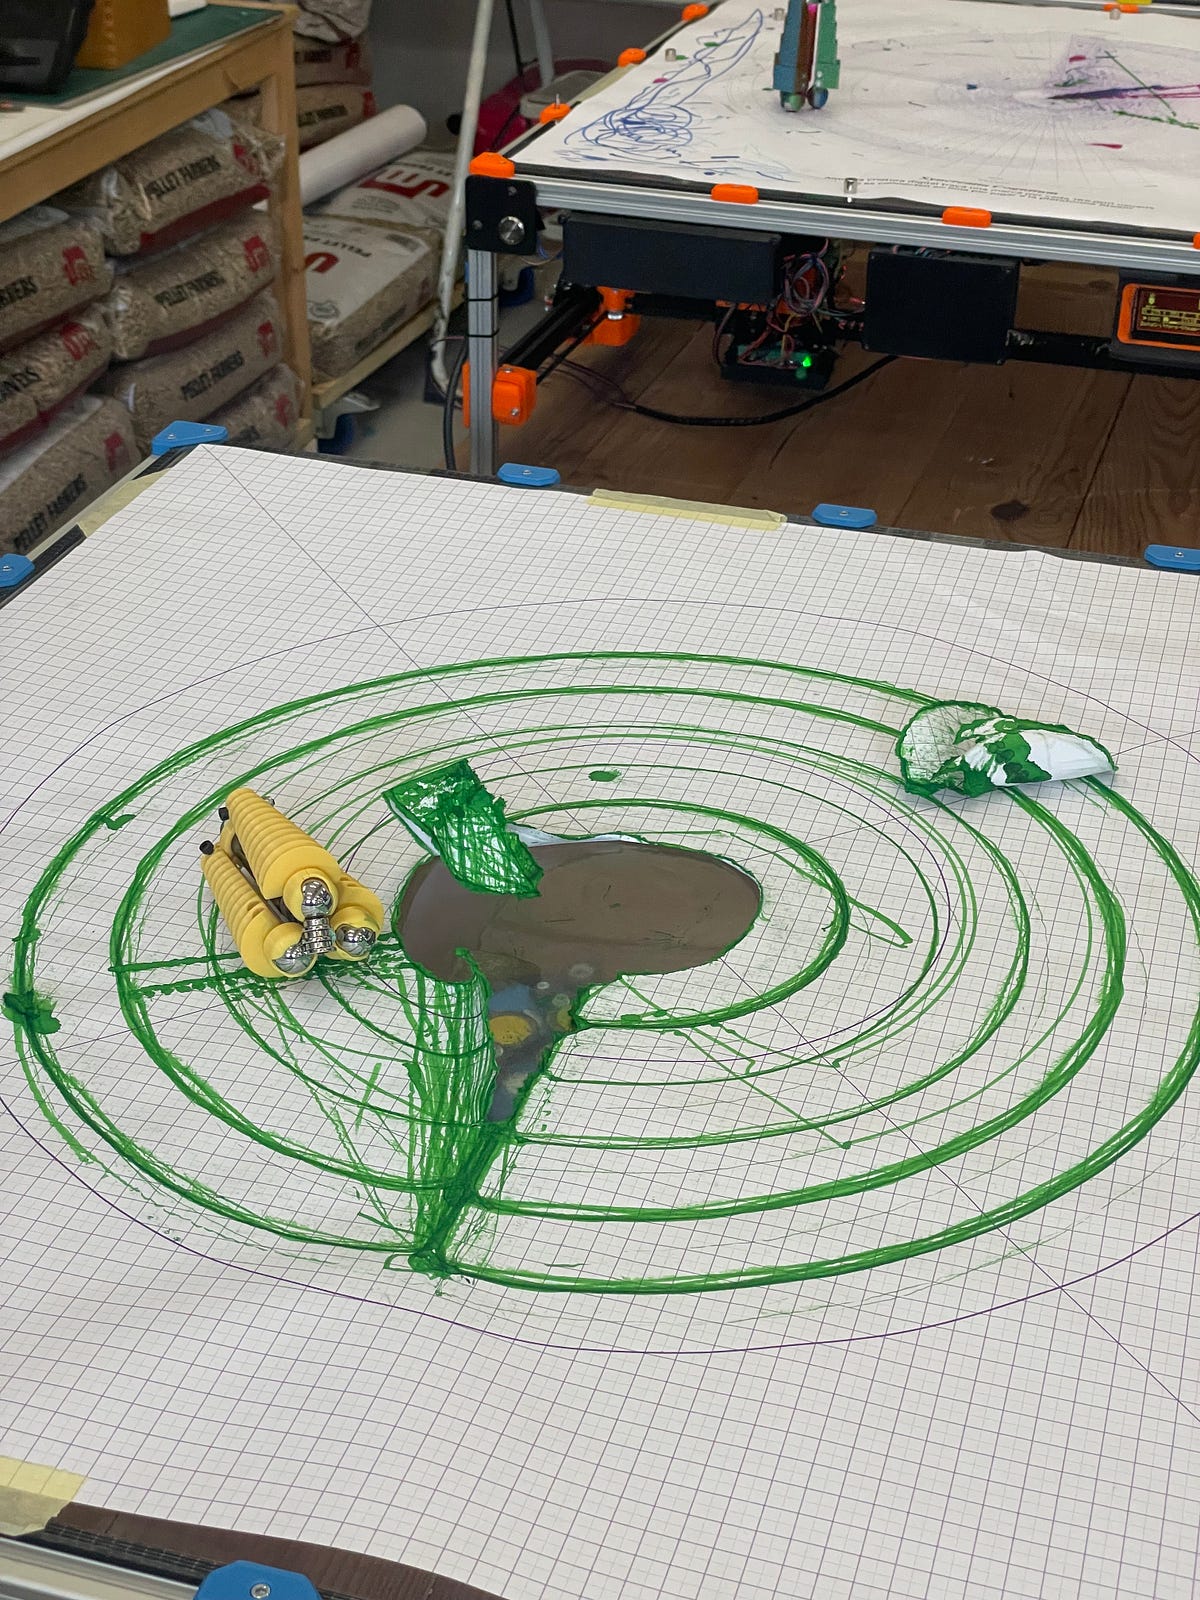
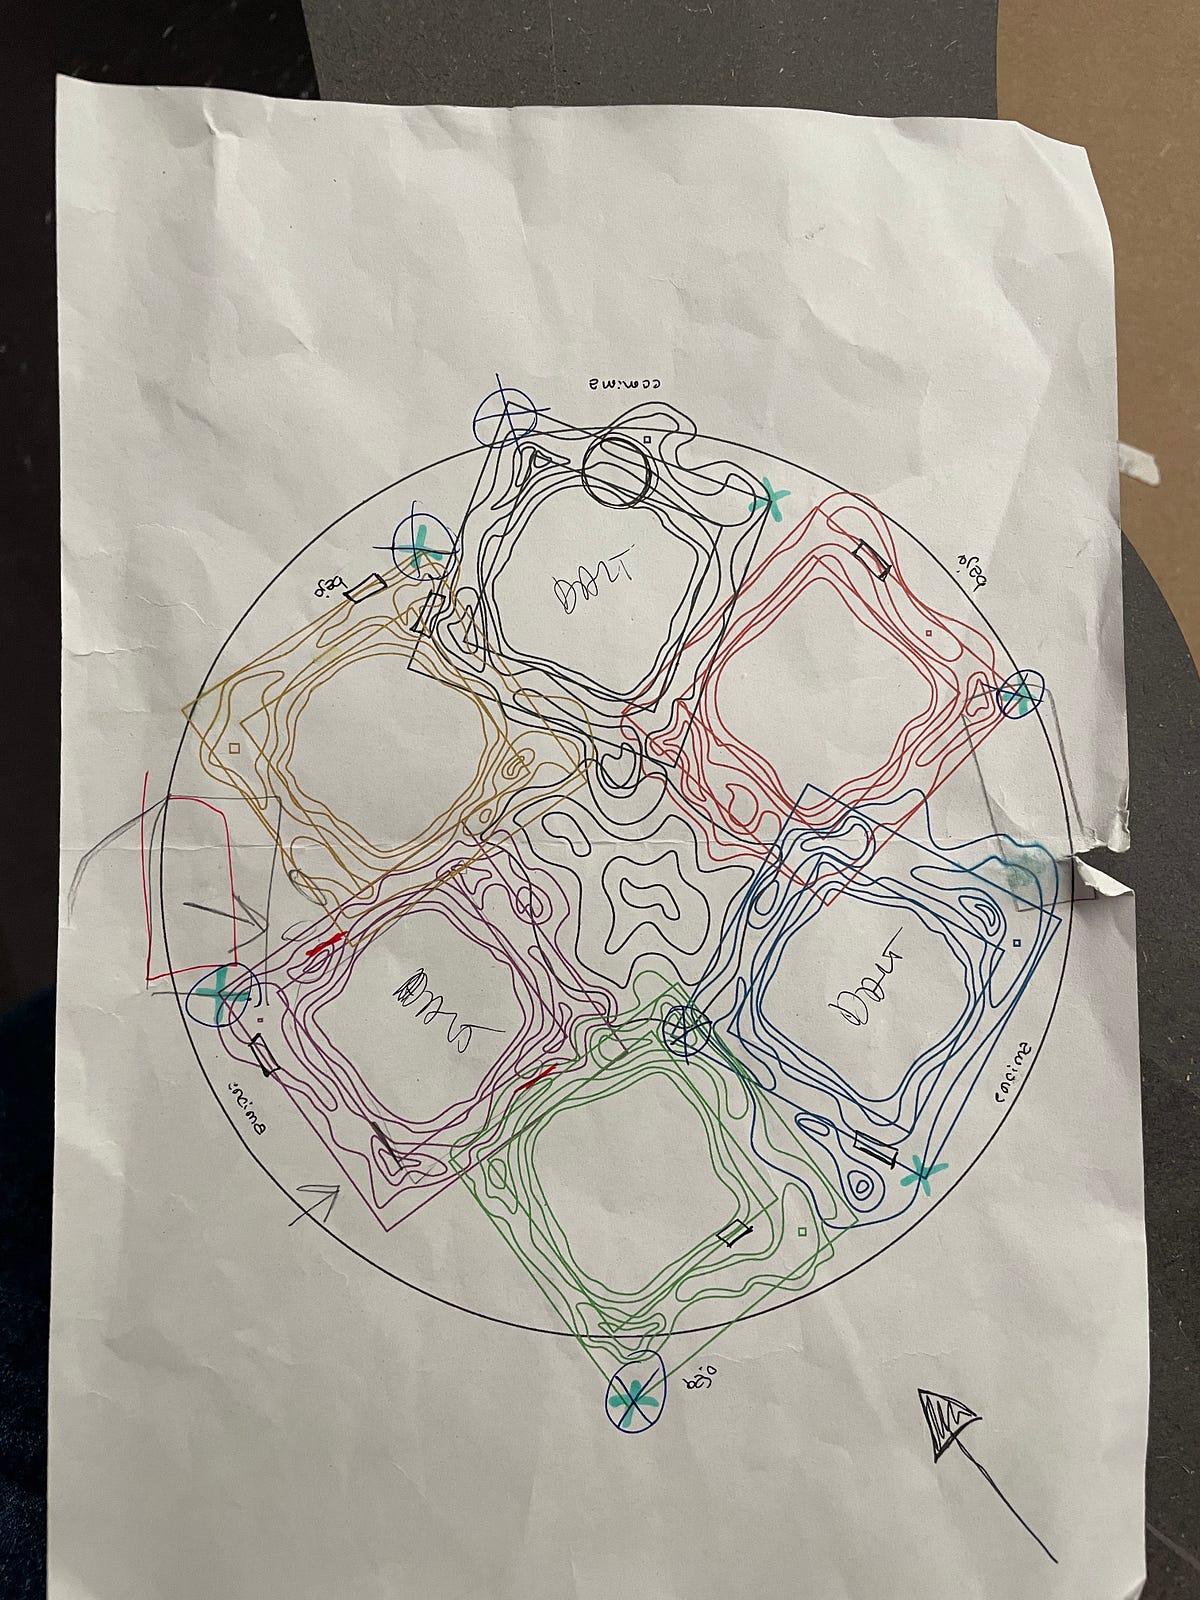
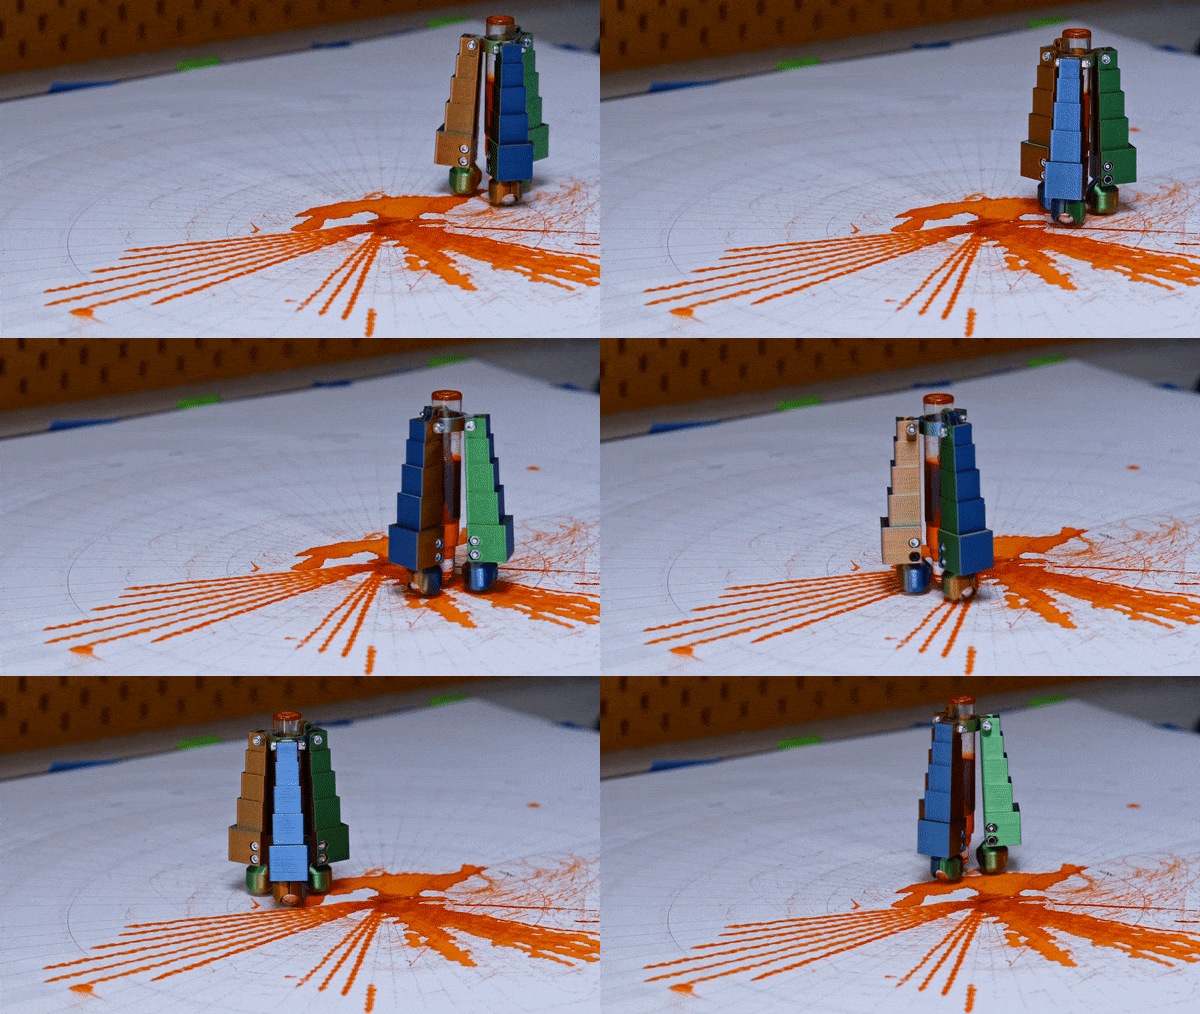
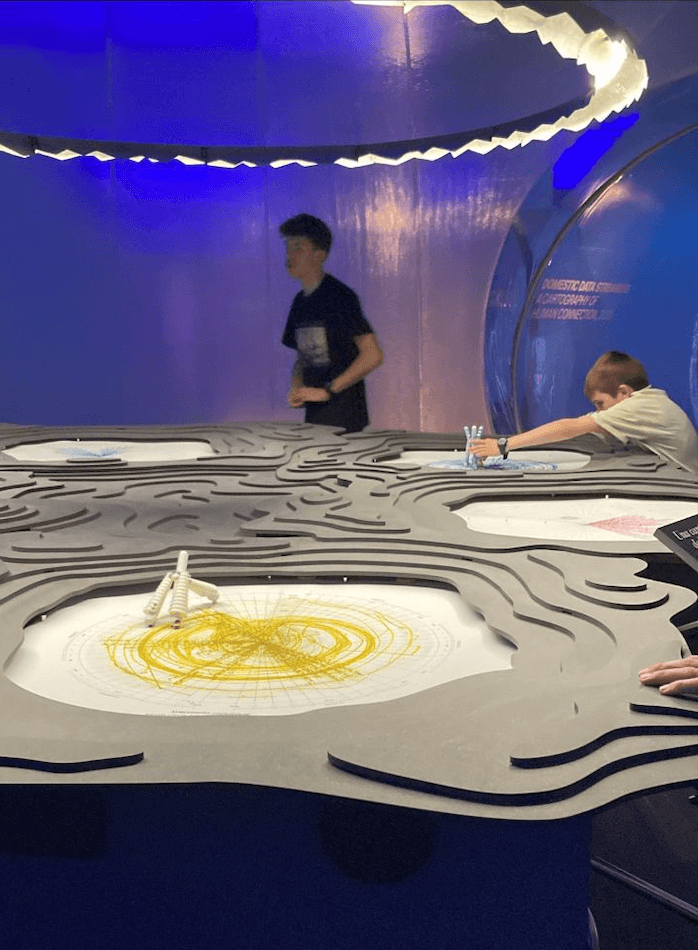
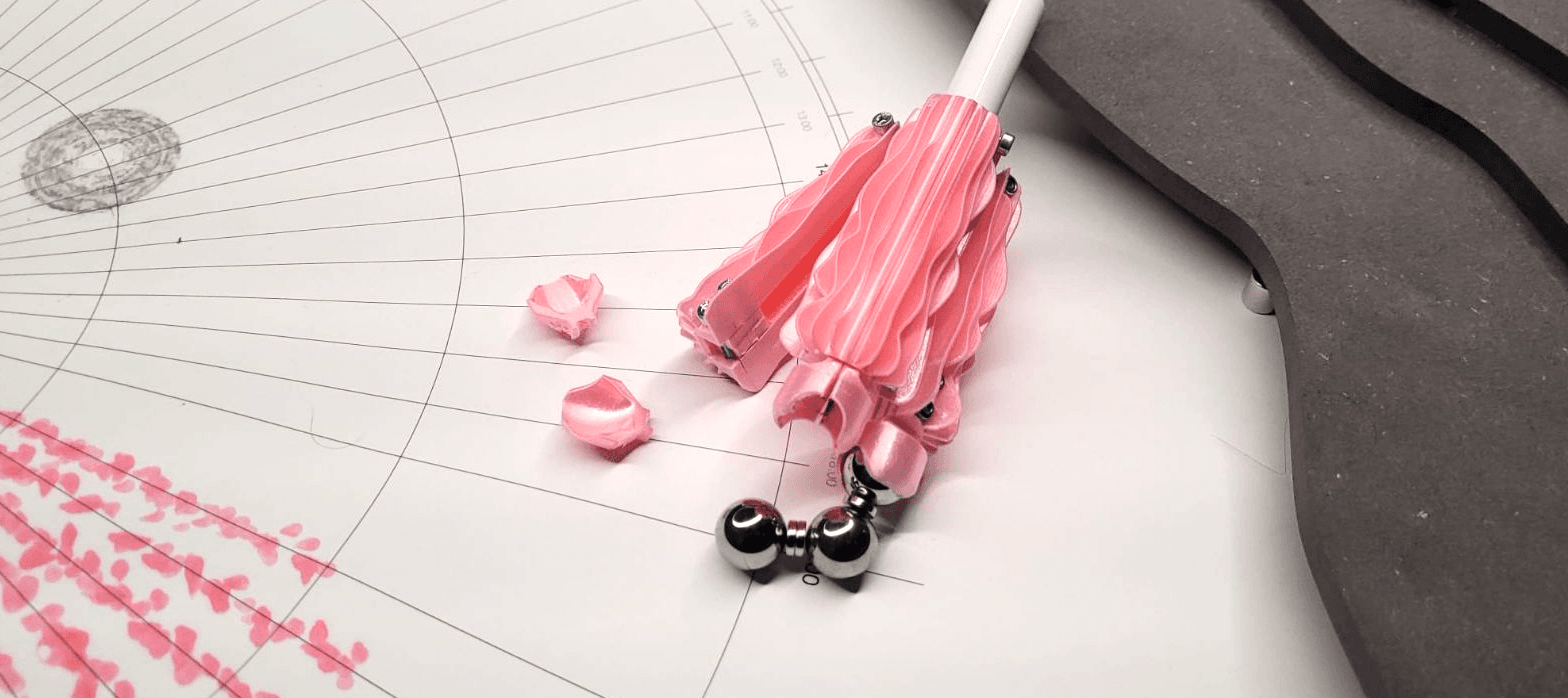
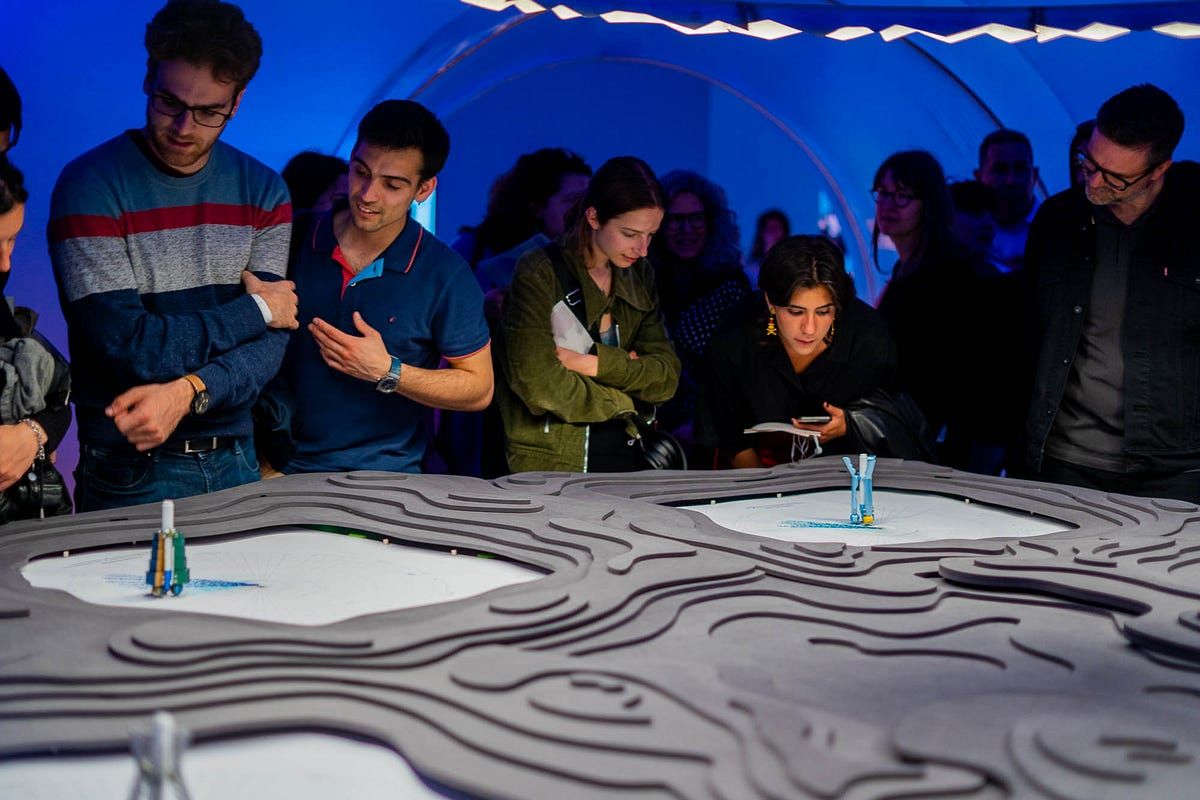
Our trusted scribes take the form of mechanical data critters whose duty is to physicalise information as it is generated in the online space. They are programmed to transform these invisible inputs into ink marks, visualizing the quantity of information that flows between us each second. Their ever-changing paths remind us that behind every data input online we find human behaviour that fluctuates and shifts according to many varying factors.
Our data critters don’t dwell on the info they receive. They don’t care for it. They incessantly mark the physical terrain, encouraging the observer to ask themselves how we can possibly set about curating such quantities of digital content. To introduce you to a few of these characters and their respective data sets:
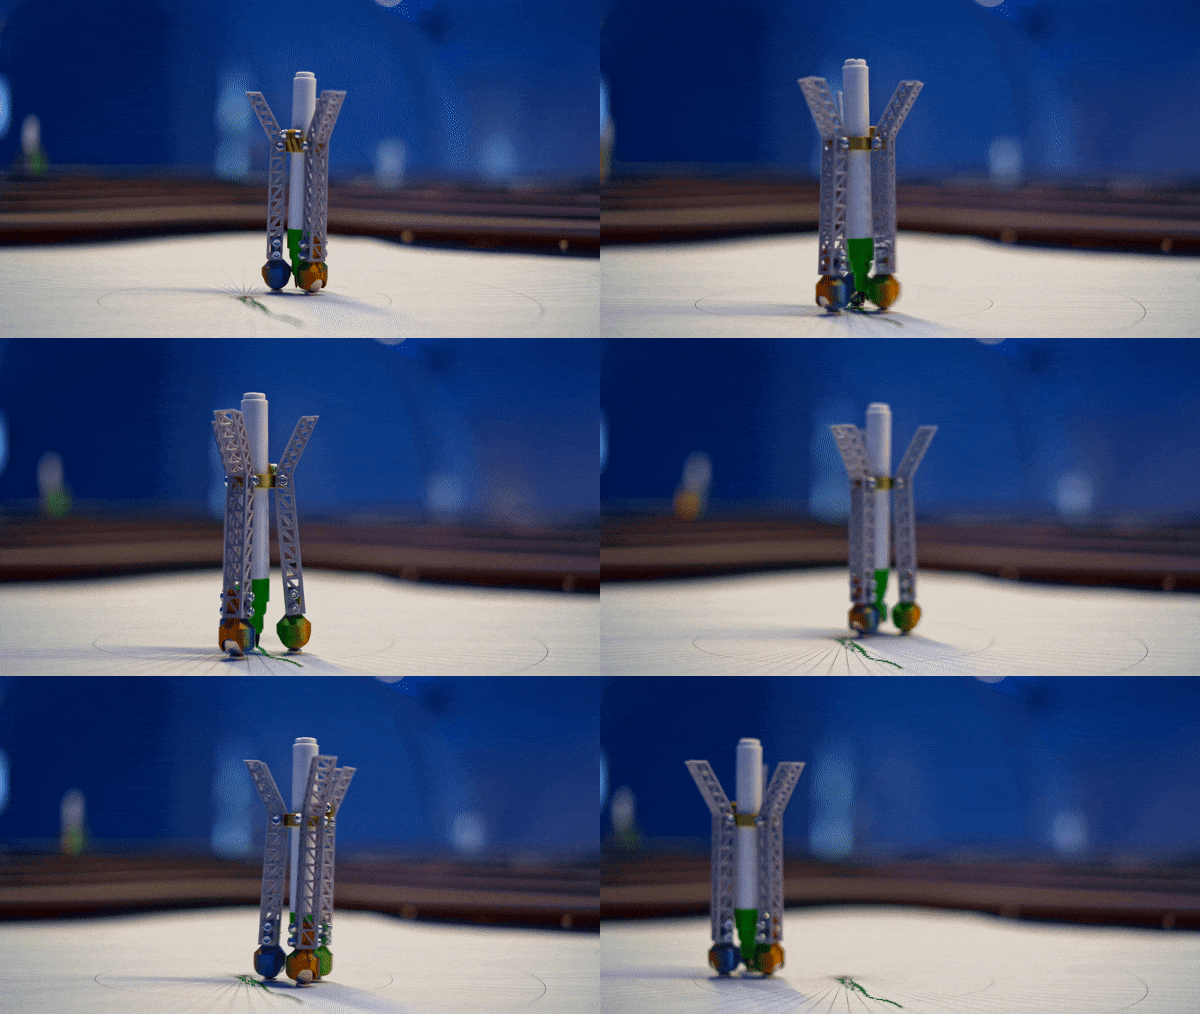
The Syncreatia Cognitium
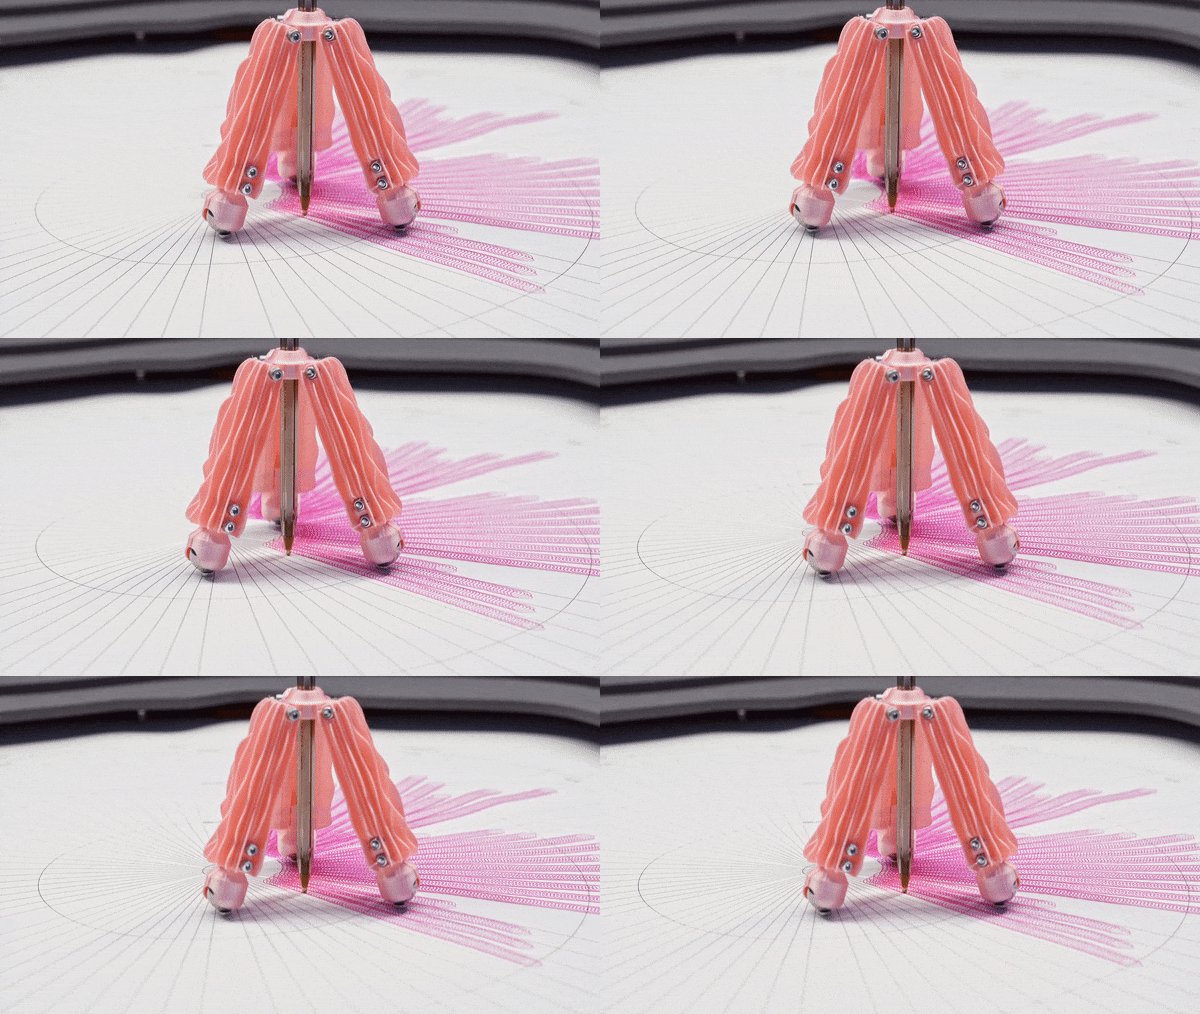
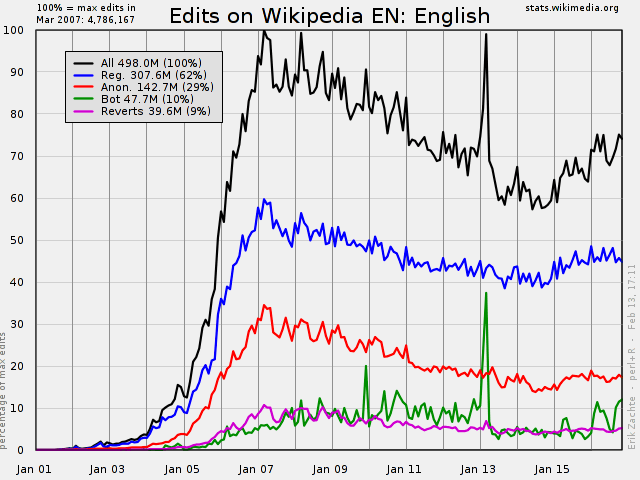
The Syncreatia Cognitium is a hive-minded critter, marking each of the 7,200 edits made on Wikipedia every hour, stressing the importance of shared knowledge and collaborative creation.
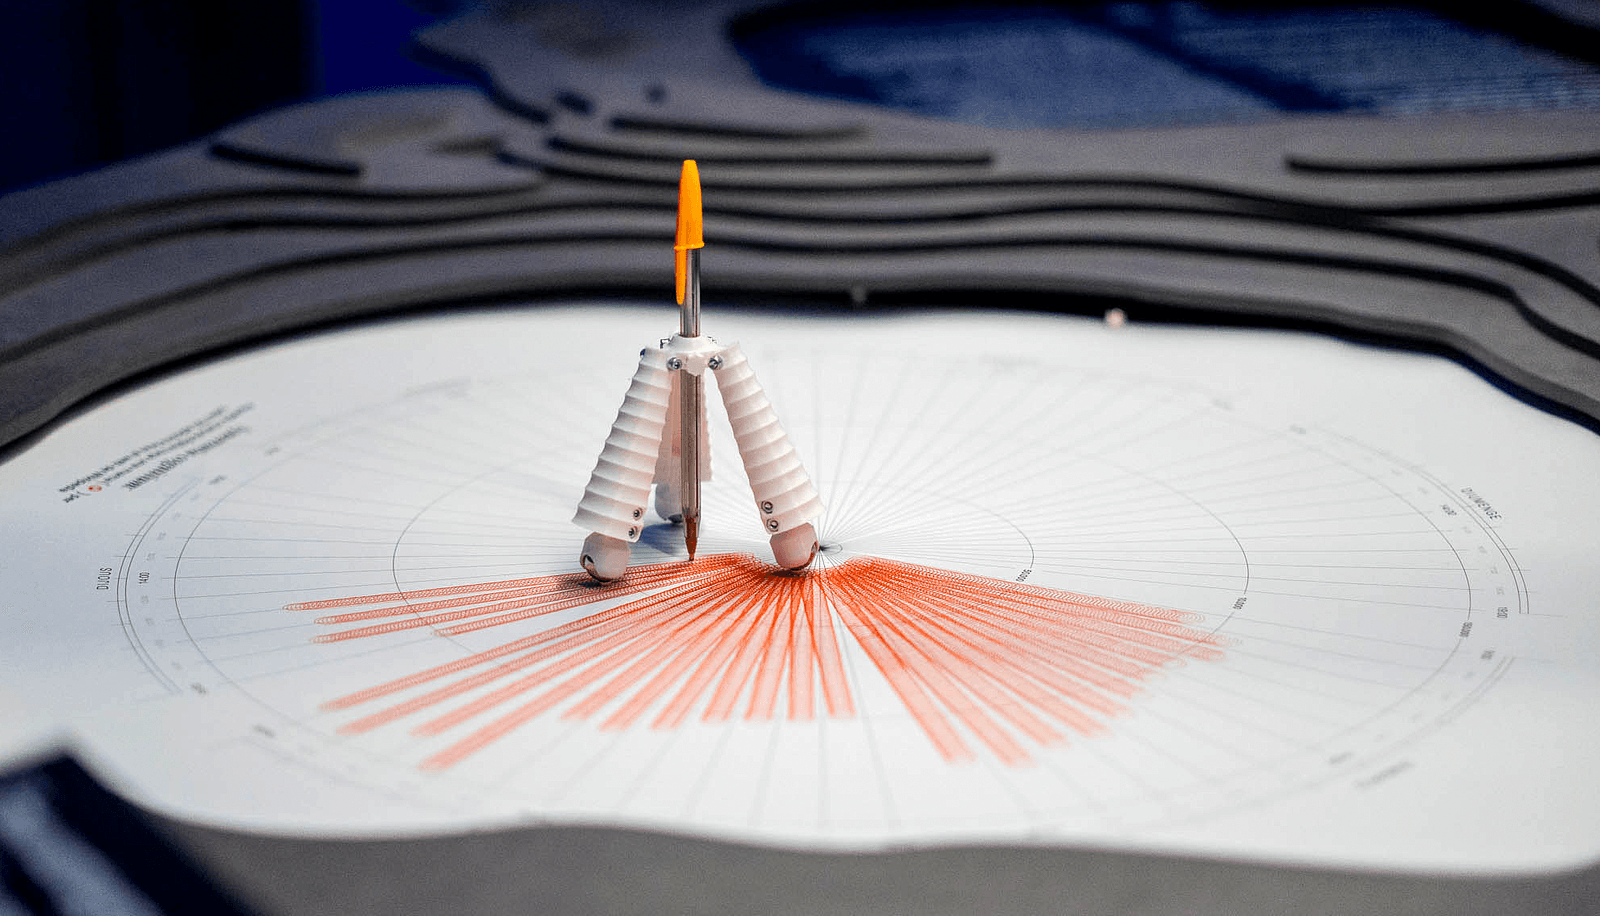
Validatus Sociae
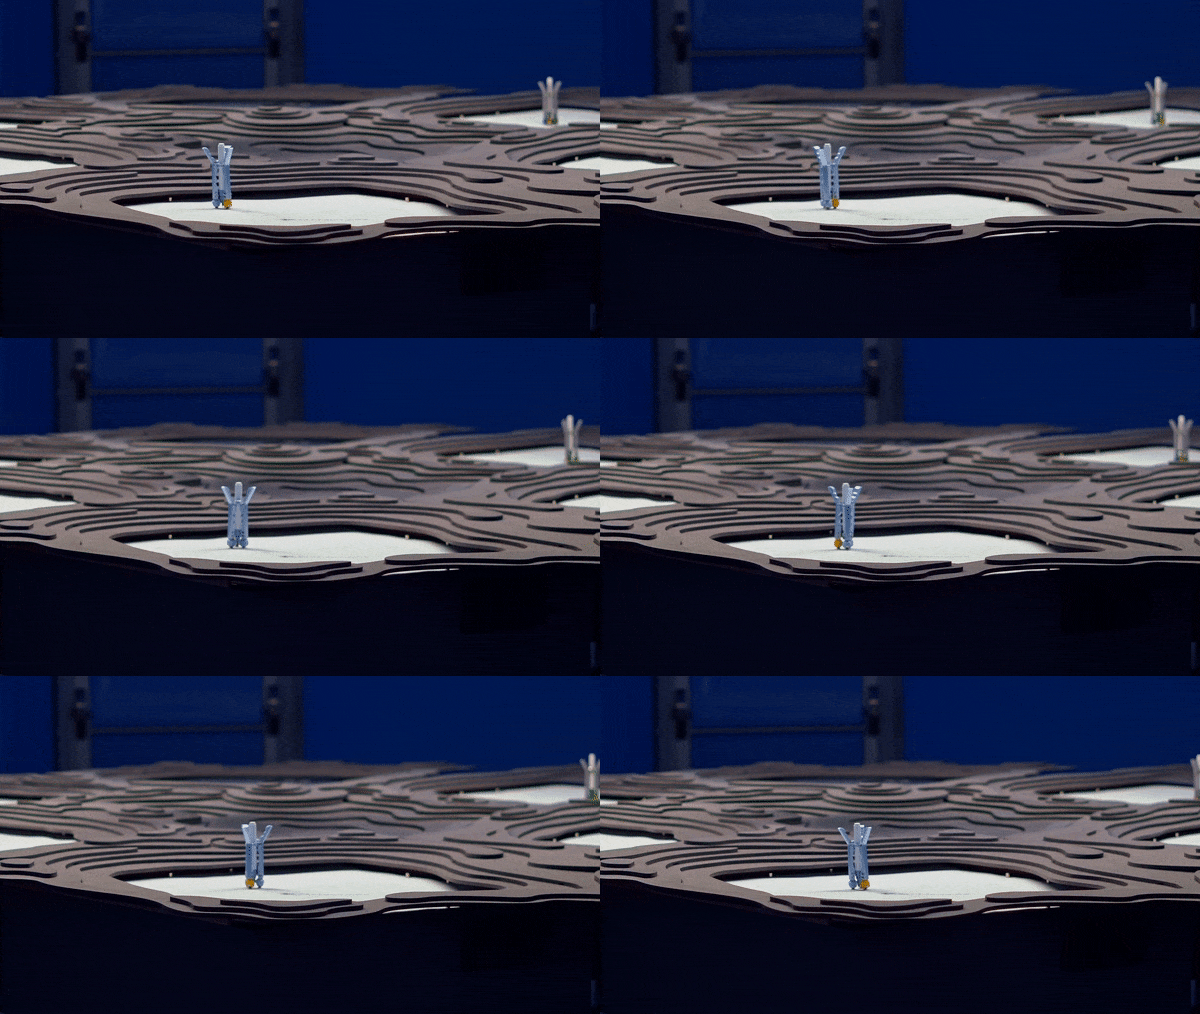
The Validatus Sociae is a shimmering, iridescent critter that continuously maps the 4.2 billion likes that are registered on Instagram every day, representing our innate desire for social acceptance and validation.
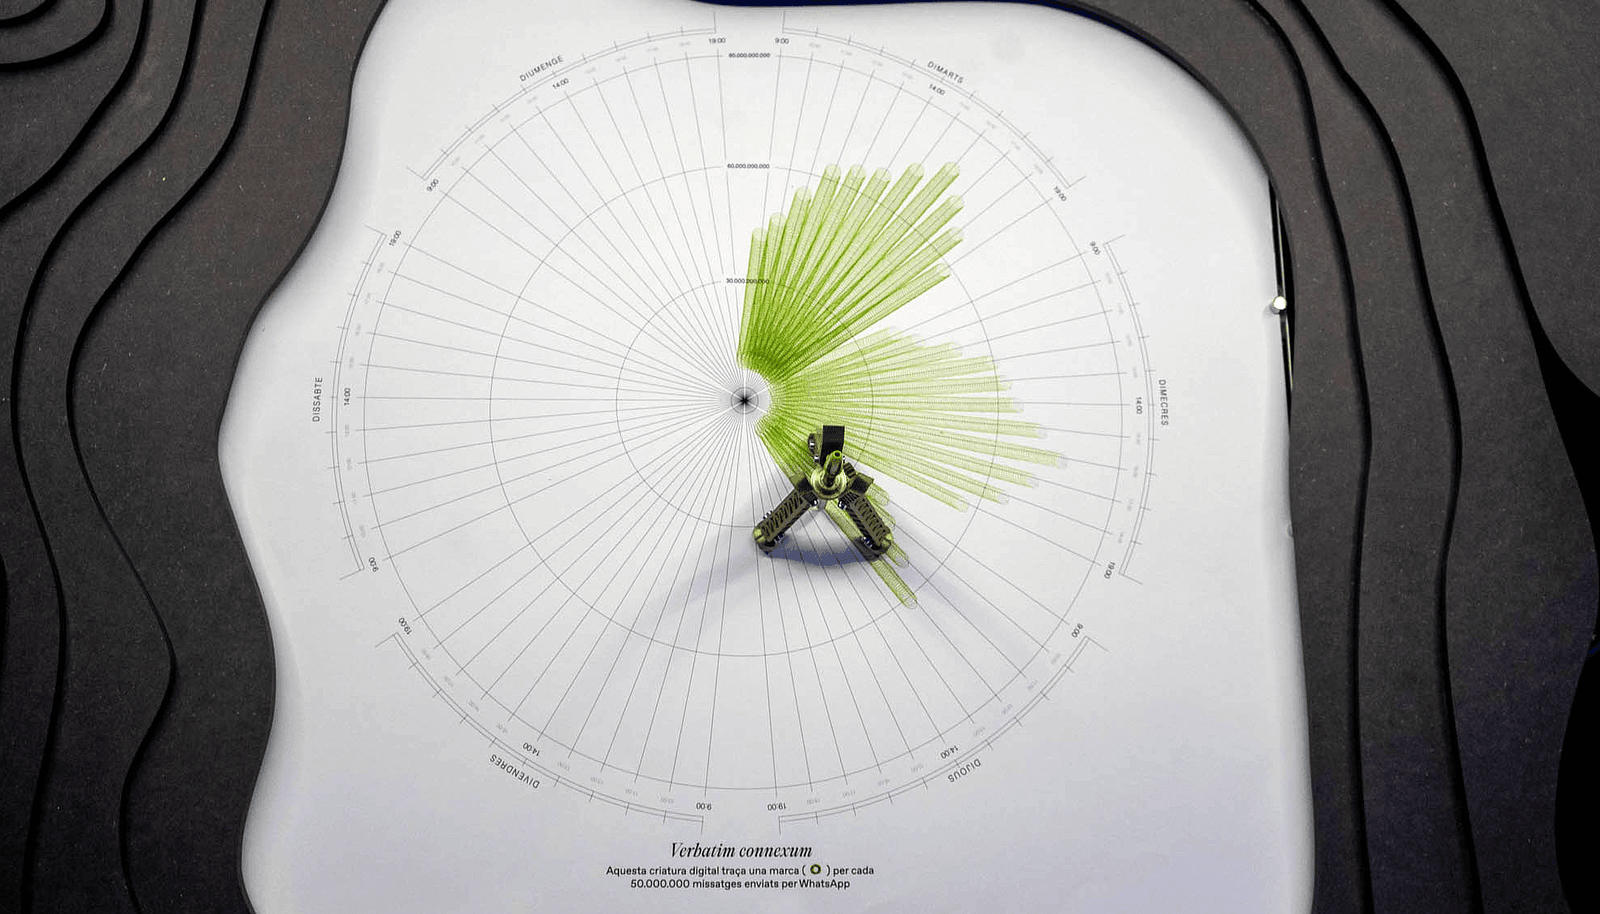
Verbatim Connexum
Verbatim Connexum is a versatile critter equipped with antennae, mapping the 4,166,666,666 messages sent over WhatsApp each hour and emphasising the role of language in global connection.
Upon unveiling this work to the public, we saw certain unexpected interactions that upset the rhythm of some of our critters. As with any of our installations, they are never really complete until the public has had their say, and in this case, their curiosity reminded us that the digital will always be a space of trial and error, despite appearances. There is a facade of perfection and infinite possibility in the digital world but it will always be rooted in our imperfect, unpredictable human reality.
Ultimately, it is up to us to ask ourselves what content should remain and who has the power to curate our digital content, and its environmental impact, for future generations. In becoming easier to create, data records have also become more transient, fragile, and open to influence. We have never been more out of control of the story we are writing as a society, and this exhibition asks visitors to consider how we may be united towards a different future by returning to the scribe that we abandoned.
After all, it is the digital footprint we leave behind that answers the question: What will our times teach the future?

This project was created by Domestic Data Streamers with the epic collaboration of our friends from Banzai Turba and Hamill Industries.

BIBLIOGRAPHY
- Crawford, Kate. Atlas of AI: Power, Politics, and the Planetary Costs of Artificial Intelligence. Yale University Press, 2021.
- Griffiths, Sarah. Why Your Internet Habits Are Not as Clean as You Think. BBC, 2020.
- United States Geological Survey. (2016). A world of minerals in your mobile device.
- Singh, M. (2020, October 30). WhatsApp is now delivering roughly 100 billion messages a day. TechCrunch.
- Petrosyan, A. (2023, May 22). Worldwide digital population 2023. Statista.
- The Shift Project. (2019, March 6). Lean ICT: Towards Digital Sobriety.
- Negroponte, N. (1998). What is Post Digital? NEXT Conference.
- Bagadiya, J. (2023, February 7). 500+ Social Media Statistics You Must Know in 2023. SocialPilot.

