Client
Design Museum of Barcelona
Year
2014
Tag
Installations
DEMO was an event structured around multidisciplinary collaborations between industry and craft exploring new creative processes and methodologies.
In this context, Domestic Data Streamers was eager to explore information about demographics and more specifically, life expectancy. That’s why we developed one of the biggest ever data experiences at the Design Museum of Barcelona.
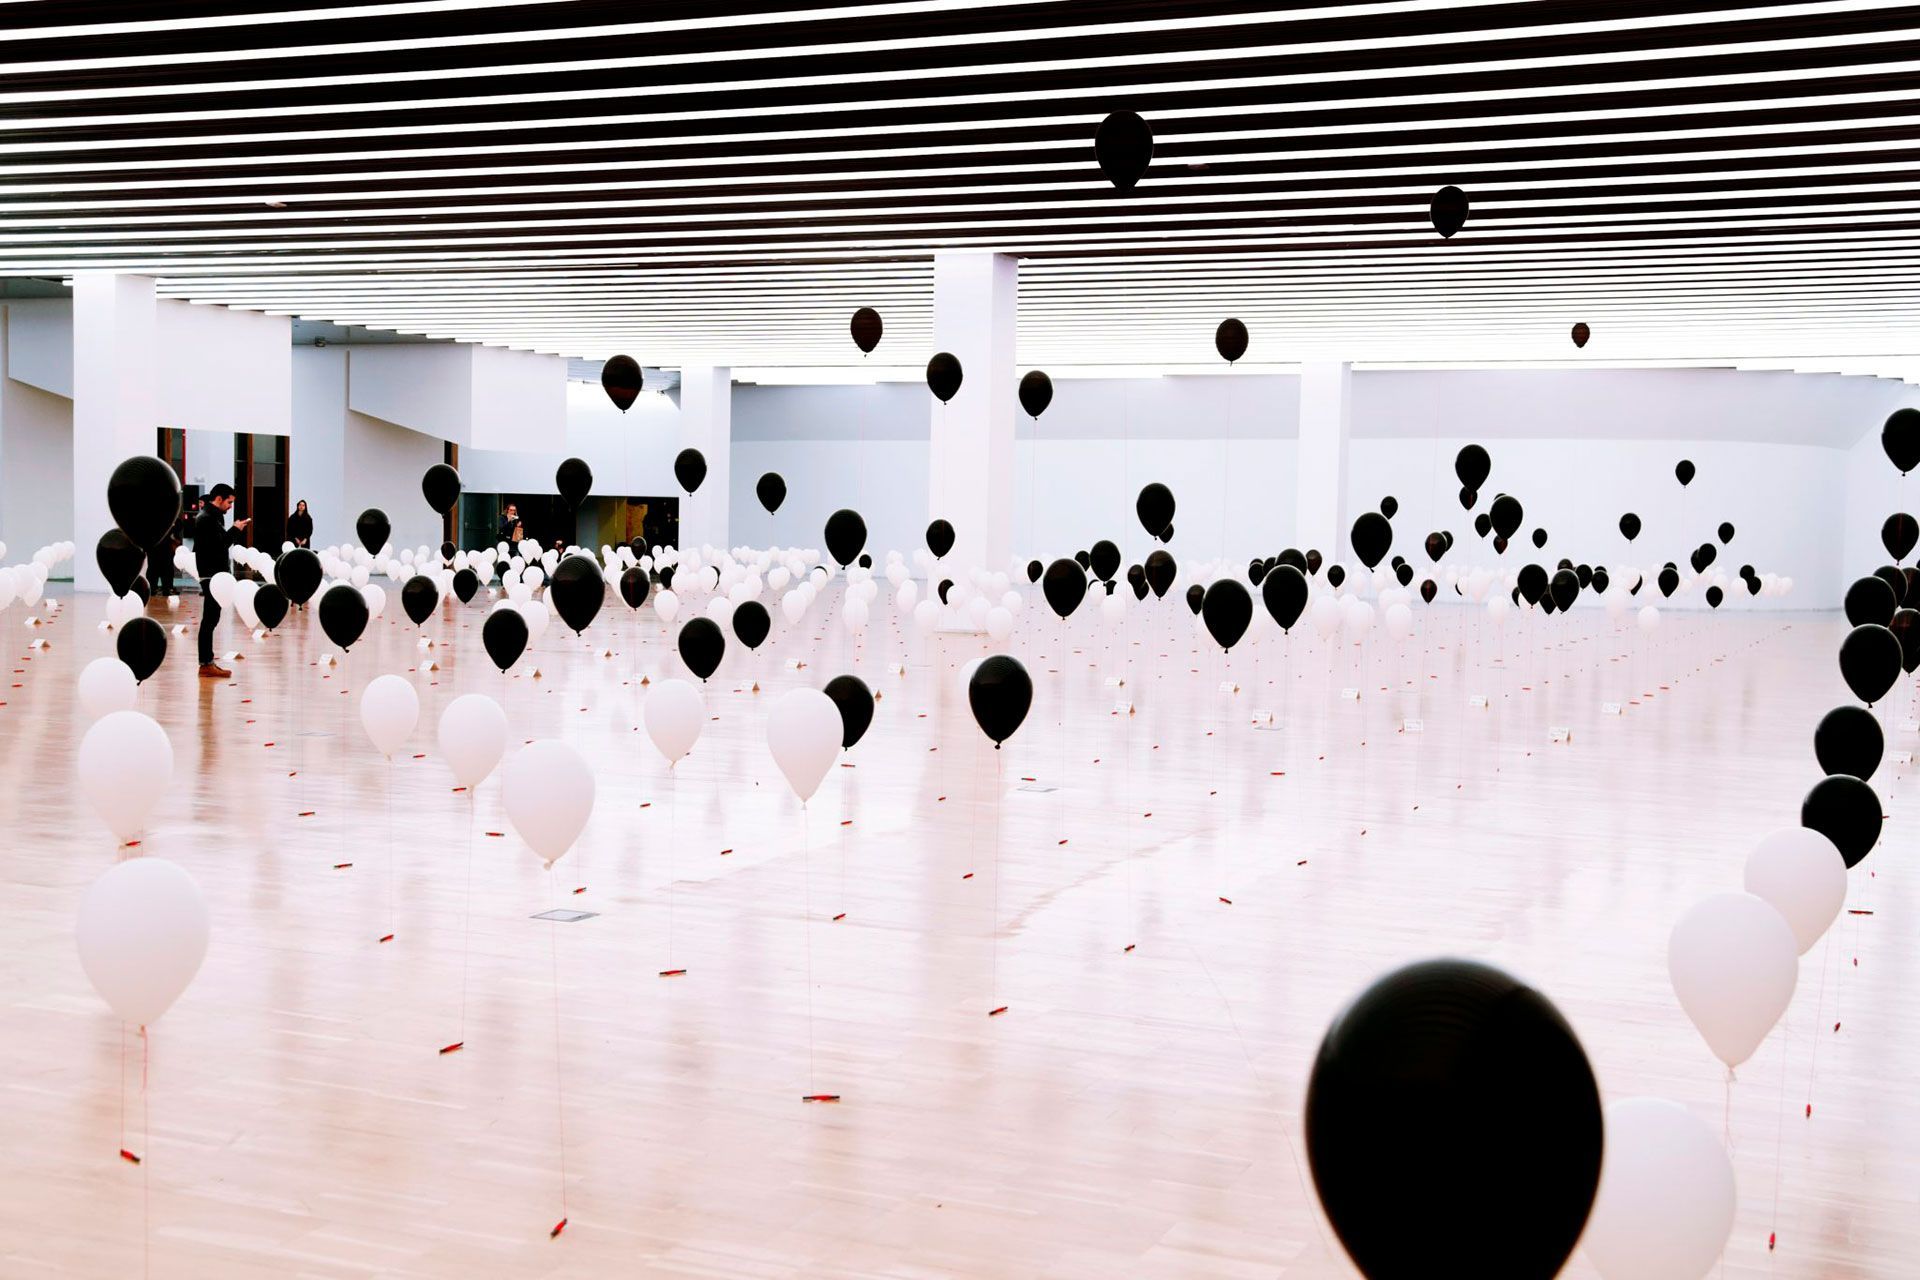

Transforming a database into an info-experience.
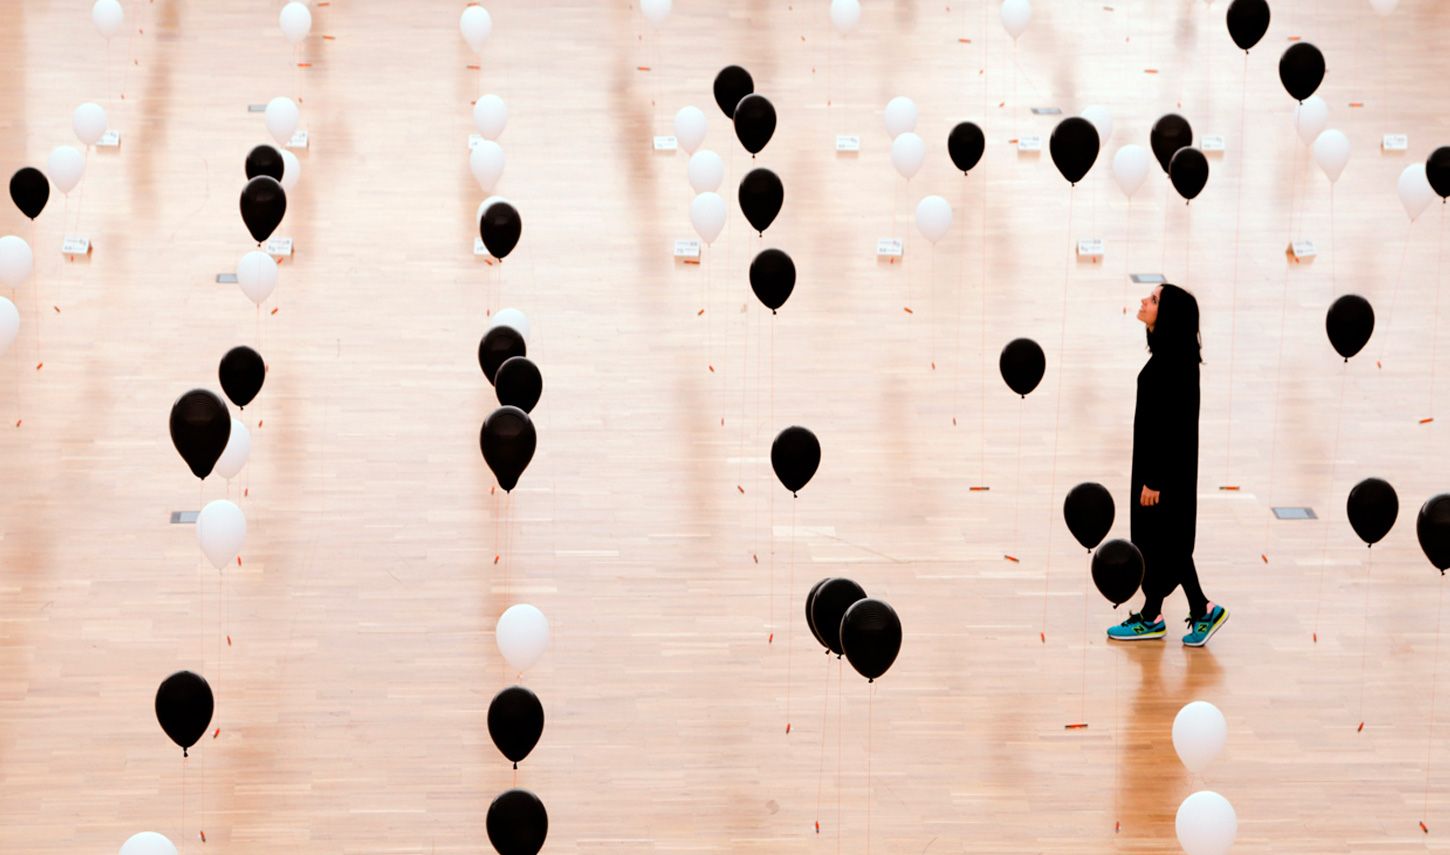
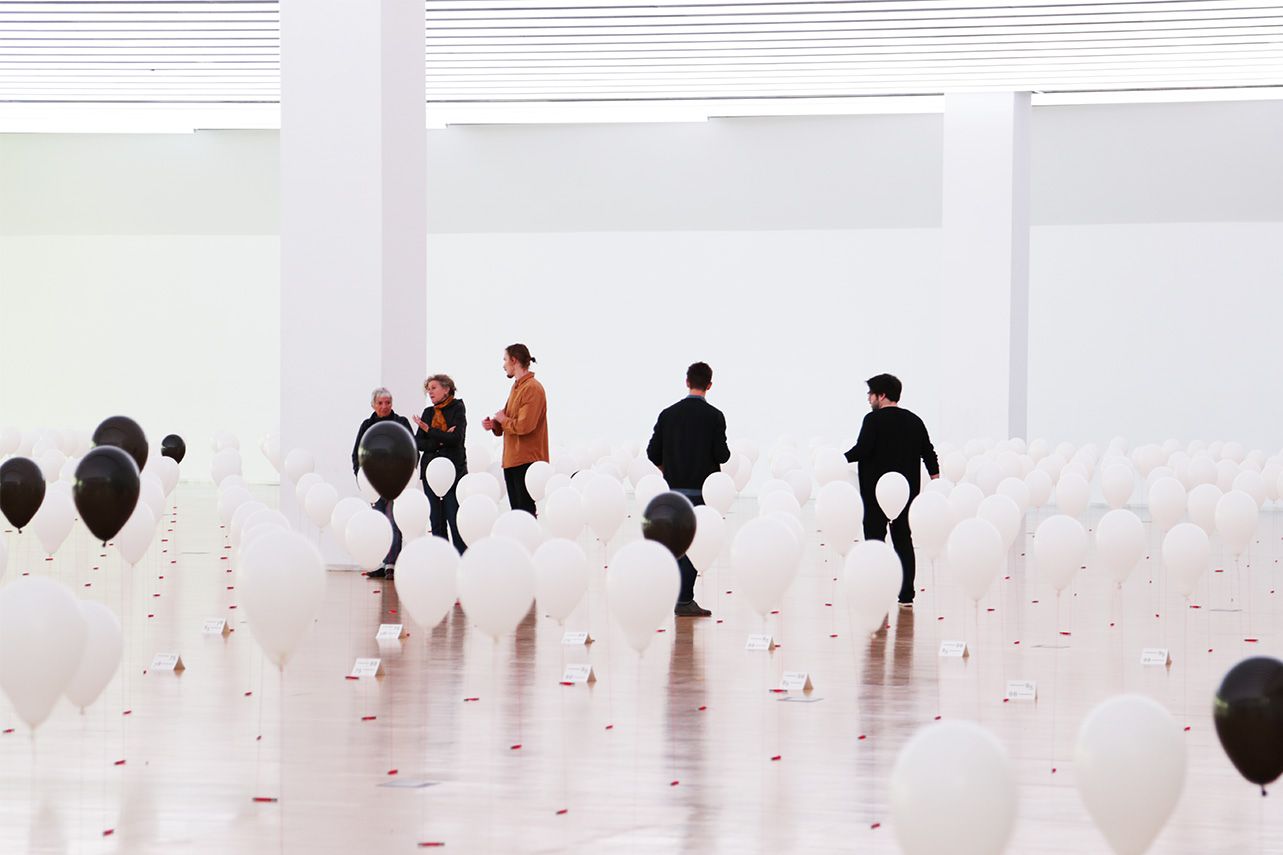
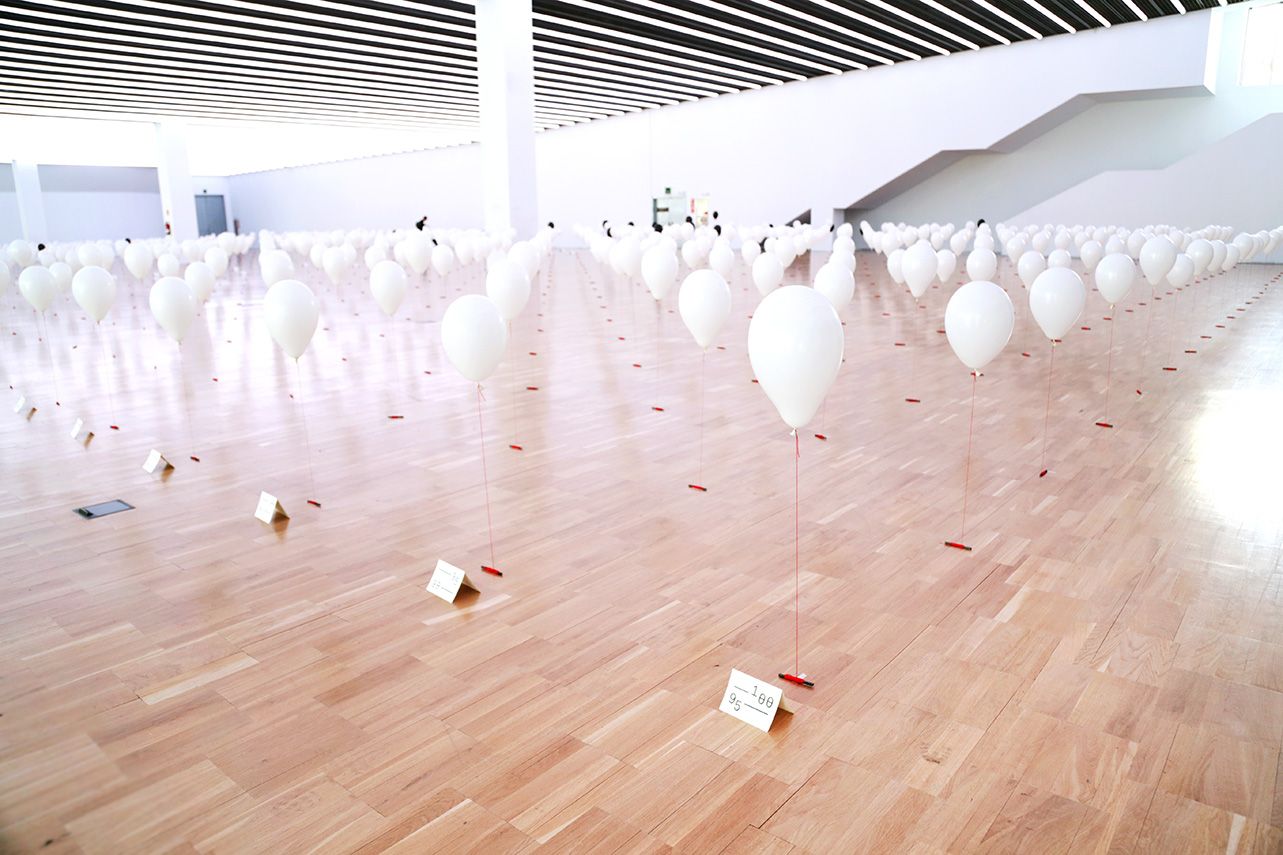
We created a space where people could physically experience data on a deeply personal and important topic. The installation was made up of a grid of 800 balloons which marked the point between one’s real age and the age at which they would like to die, contrasting the information with their gender. The higher the balloon the more answers that point had from the public. The white balloons represented spaces where no one wanted to die.
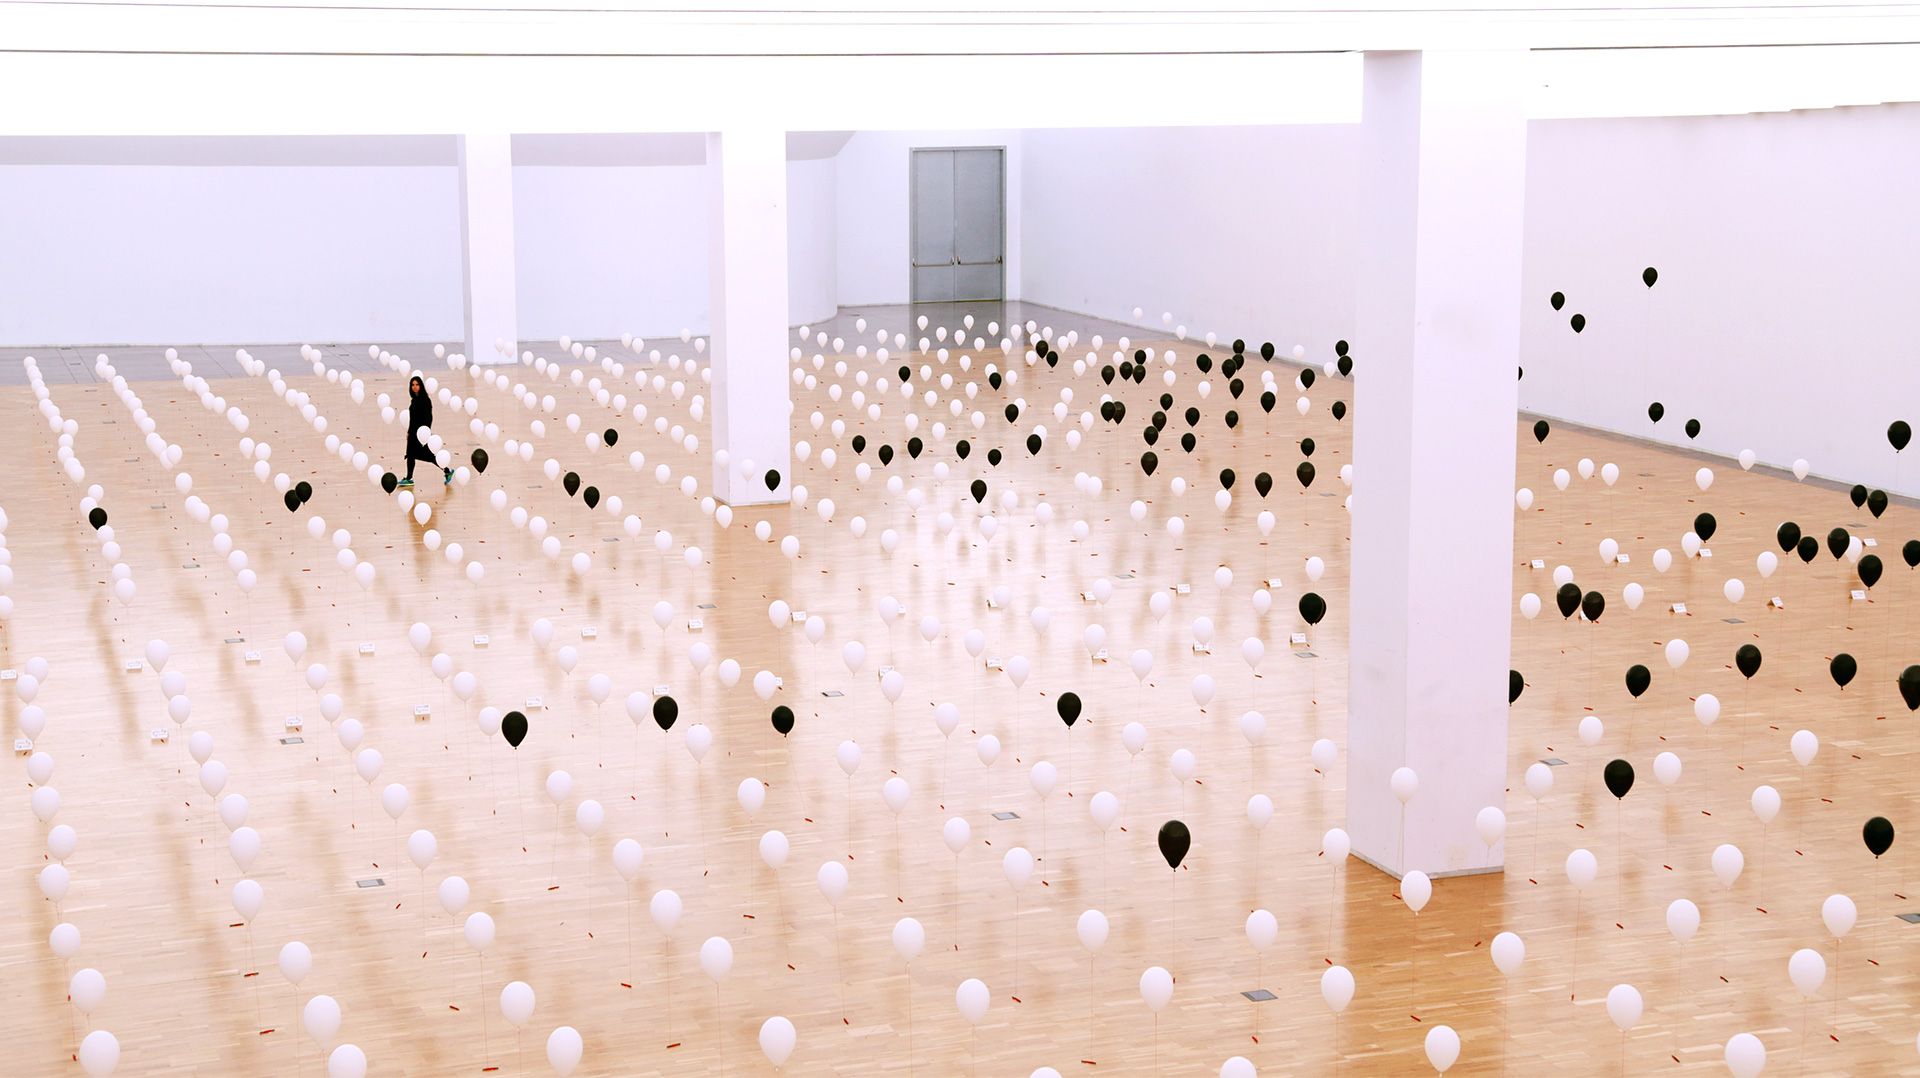
The building of the database
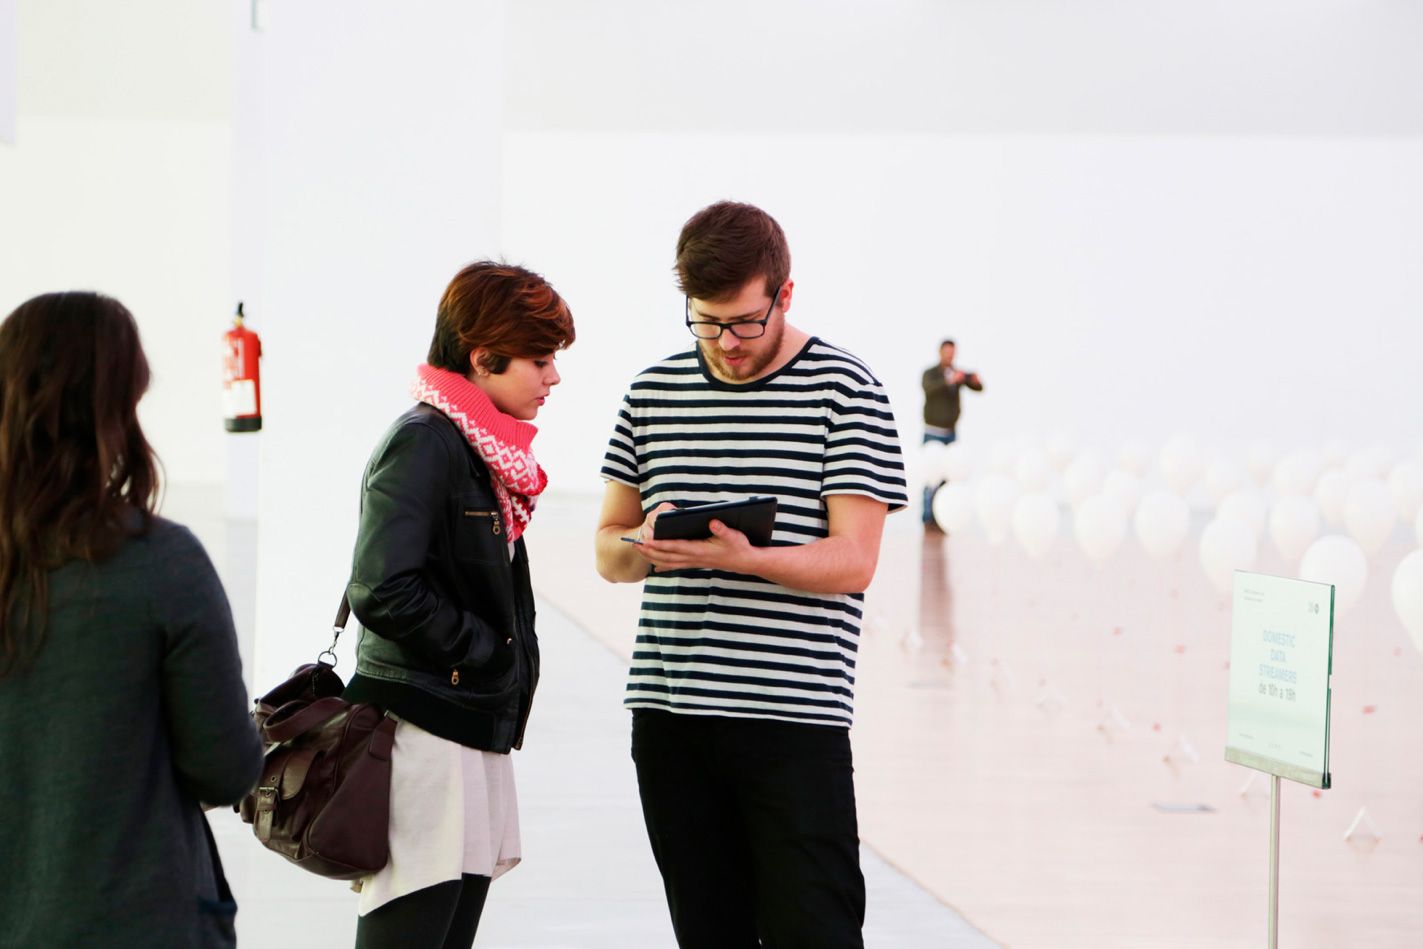
For 12 hours, 15 anthropologists around the city of Barcelona carried out surveys on different demographics and their life expectancy, both on the street and in the Design Museum, interviewing more than 2,000 people. We transformed all the collected data into a three dimensional infographic that filled a space measuring 90 x 30 metres.
Individual readings towards collective discussions
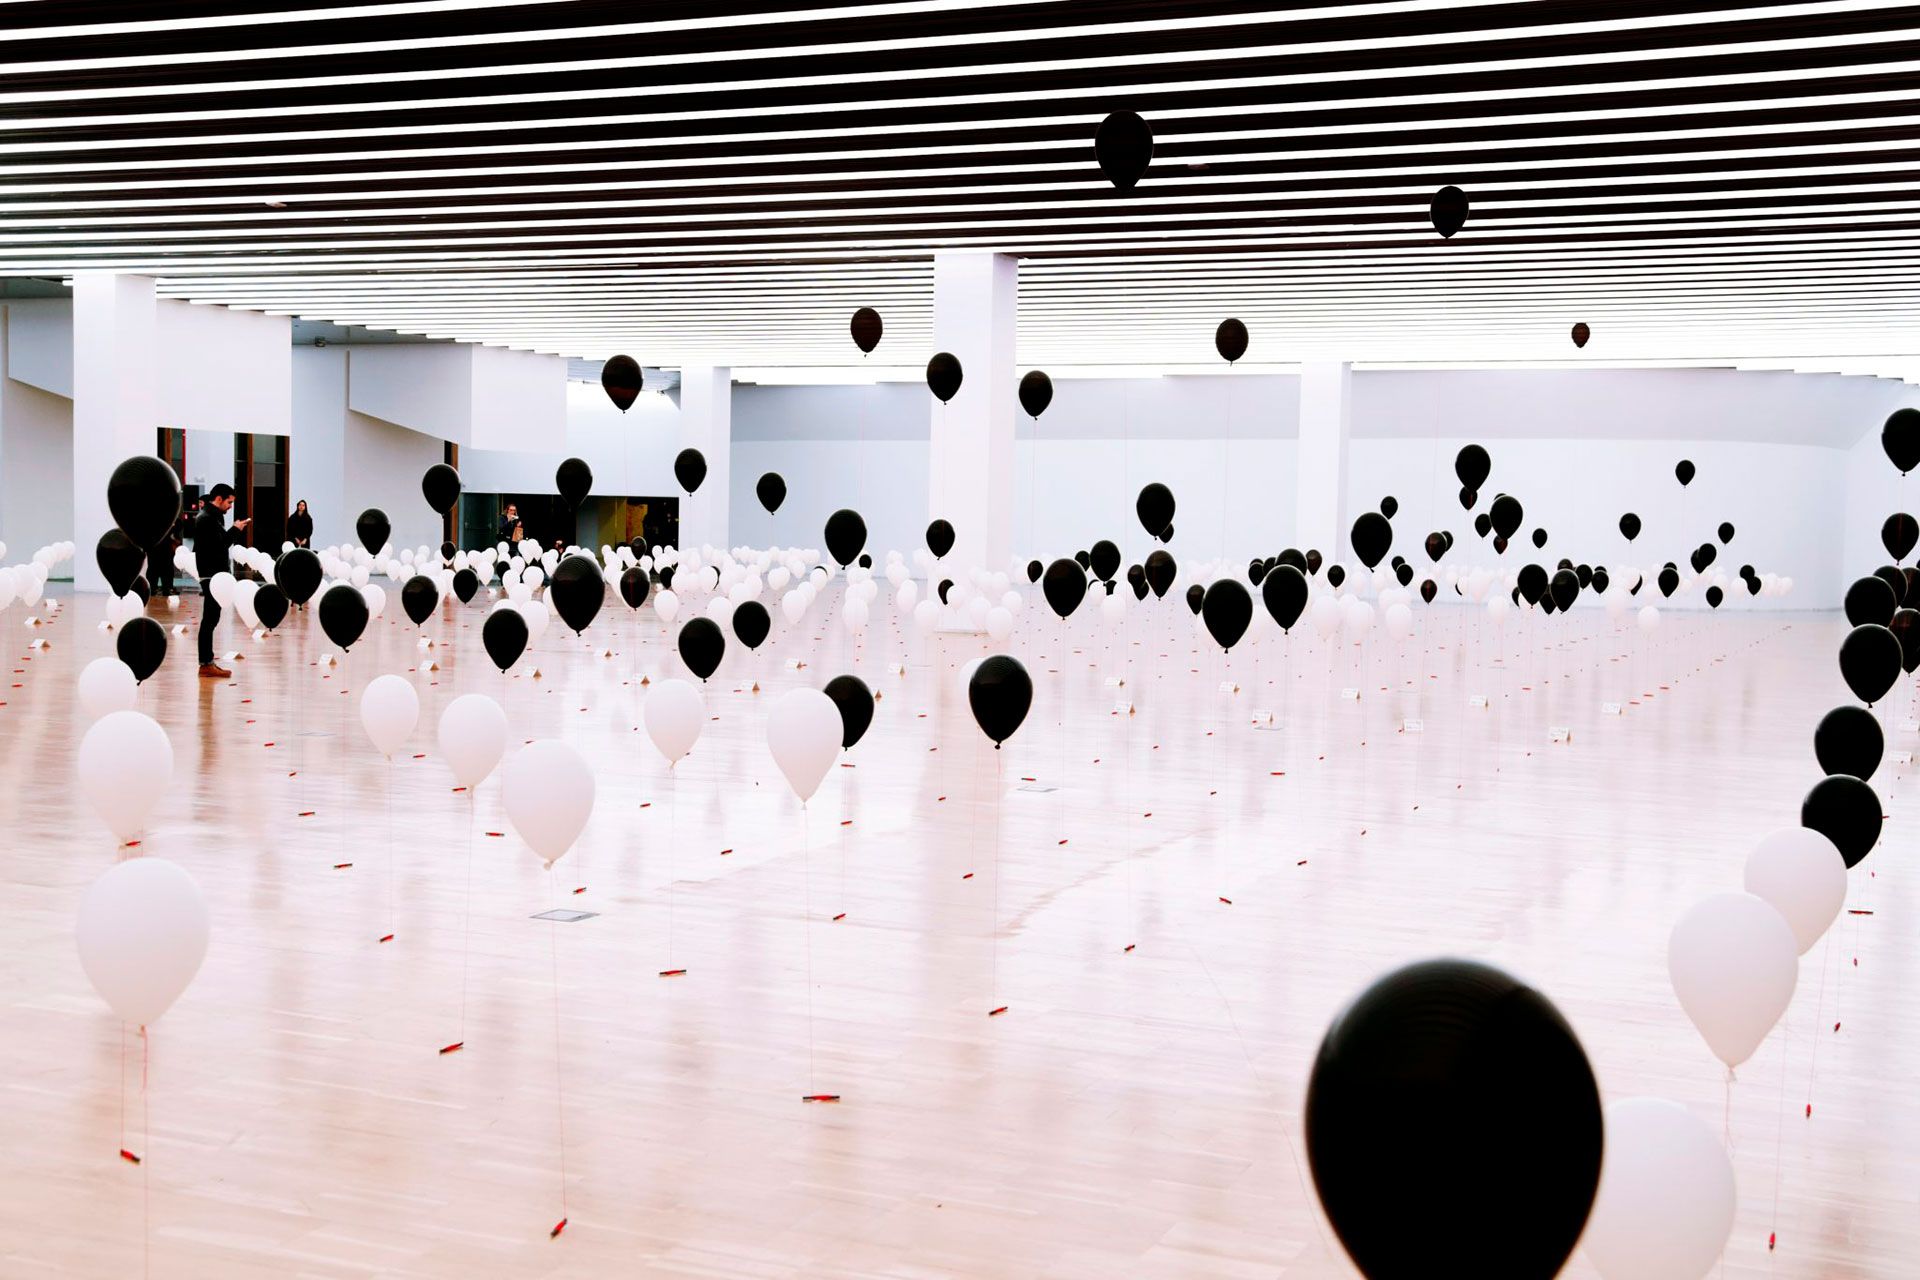
Today we are used to consuming information as a solitary experience, from our phones, laptops and even the newspapers. By displaying information in a three-dimensional space we created an area for collective processing, a space for discussion, where everyone was invited to speak their minds and compare their own answers with the general public.
